System design
To accurately reconstruct images from emission sinograms, information about the attenuation is needed. Recall that more information is needed for SPECT than for PET (section Attenuation correction). For PET, the sinograms can be precorrected for attenuation and then be reconstructed with FBP. For SPECT, there is no simple attenuation precorrection.
If reconstruction is done with MLEM, precorrection is not recommended since it destroys the Poisson nature of the data. It is better to include the attenuation factors in the coefficients in equation (33). Remember that MLEM deals with attenuation by simulating it, not by inverting it: there is no explicit attenuation correction in MLEM. The MLEM-algorithm simulates the effect of attenuation during projection, and will iterate until the computed projections are (nearly) equal to the measured ones. When attenuation is included the coefficients can be rewritten as
where is the detection sensitivity in absence of attenuation.
Several configurations have been devised to enable transmission scanning on the gamma camera. As a transmission source, point sources, line sources and sheet sources have been proposed. Figure 1 shows a scanning line source configuration. The line source is collimated both axially and transaxially. Collimation avoids photon emission along lines that are not accepted by the collimator in front of the crystal. Elimination of those photons reduces exposure to patient and personnel, and reduces the contribution of scattered photons.
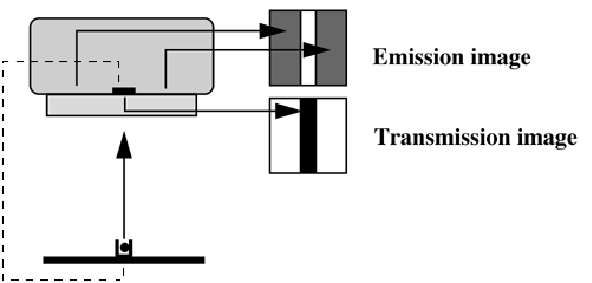
Figure 1:Scanning transmission source in a gamma camera. An electronic window is synchronized with the source, improving separation of transmission and emission counts.
The transmission isotope is selected to emit photons at an energy different from the emission tracer. Thus, emission and transmission photons can be separated, enabling simultaneous acquisition of transmission and emission projections. In the scanning line source configuration, an electronic window is moved in synchronization with the source. Photons outside the electronic window cannot have originated in the source, and must be due to scatter from emission photons (if the energy of the emission isotope is higher). Consequently, the electronic window improves the separation already achieved with the energy windows.
Figure 2 shows a typical PET transmission configuration. One or a few rotating rod sources are used. In theory, a single photon emitter could be used, since the position of the rod sources is known at all times. However, current systems usually use a positron emitter, so separation based on energy windowing is not possible. Again, small electronic windows (selecting only projection lines involving a detector close to the source) are used, which reduce the emission contamination with a factor of about 40. The remaining contamination can be estimated from an emission sinogram acquired immediately before or after the transmission scan.
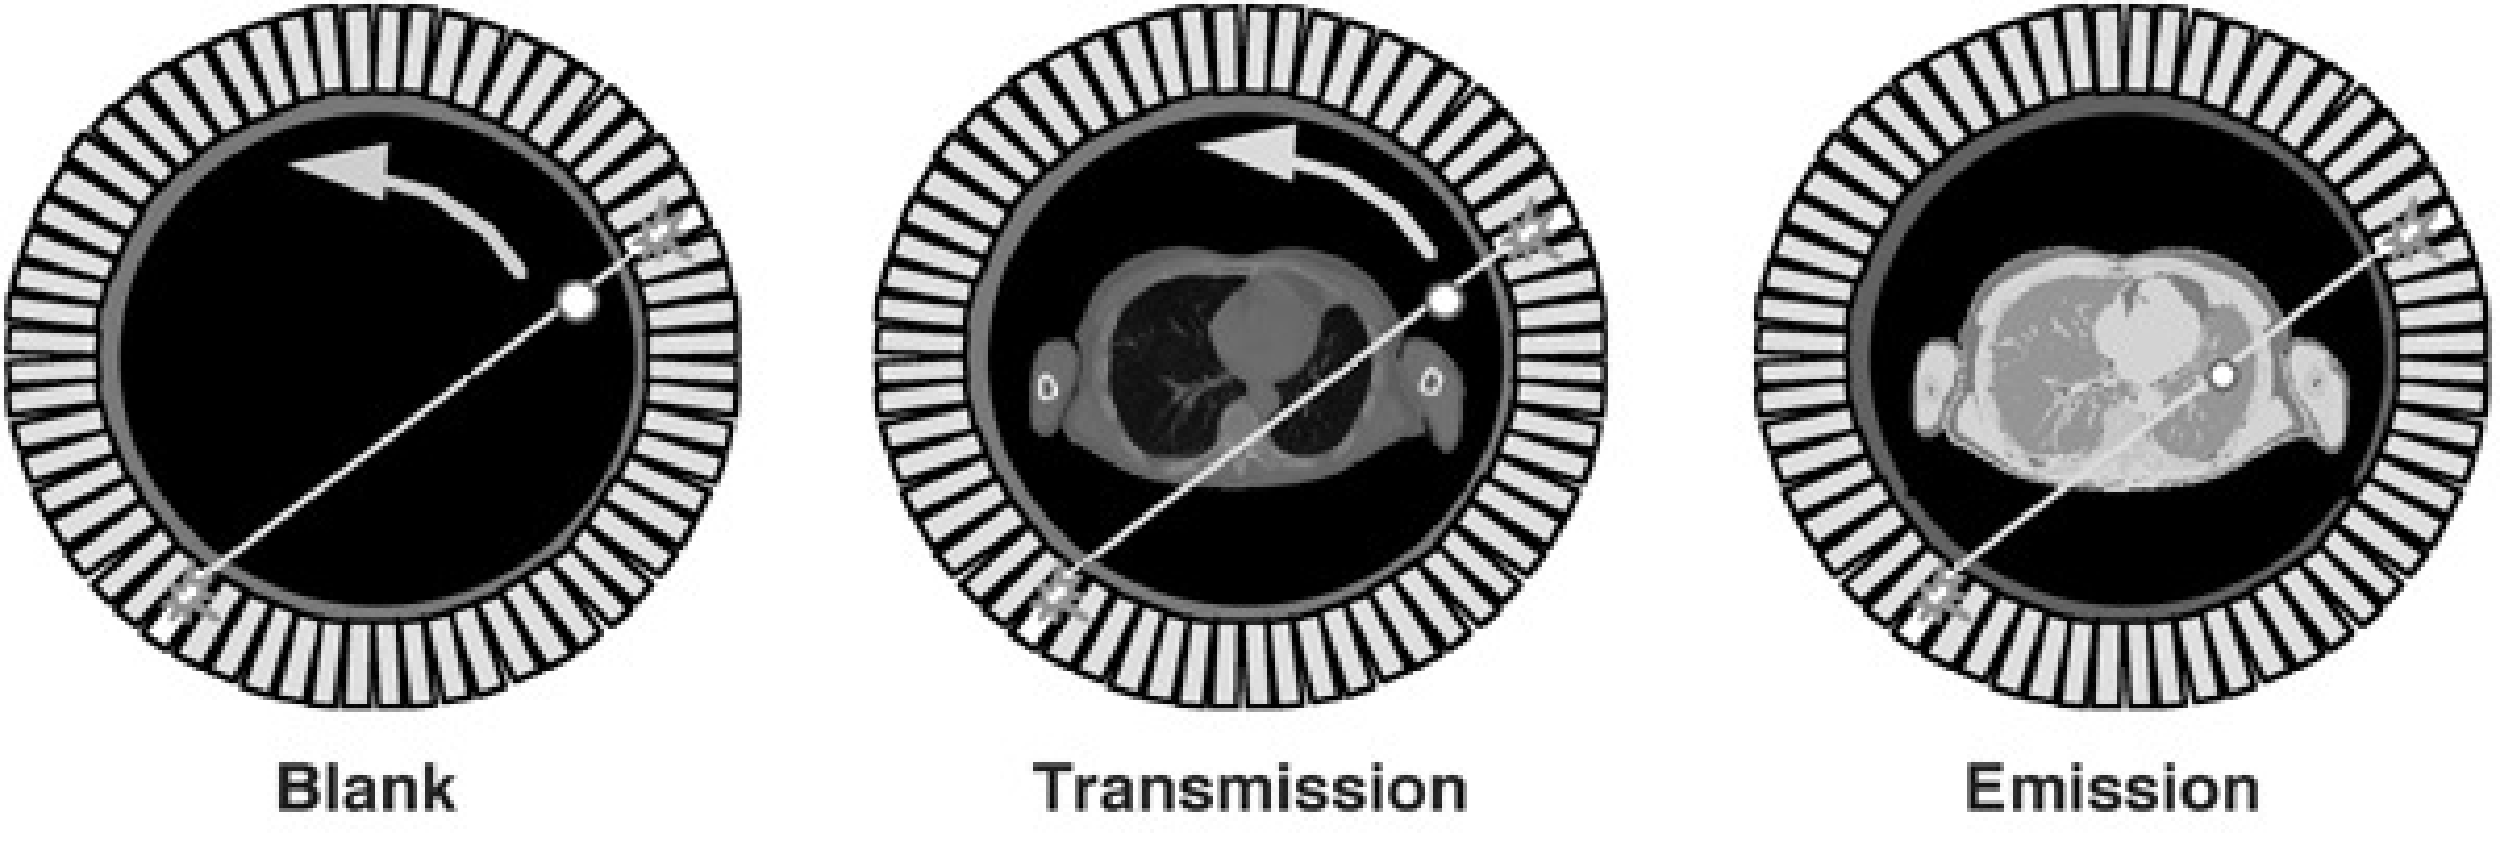
Figure 2:Rotating transmission source in PET. As a reference, a blank scan is acquired daily.
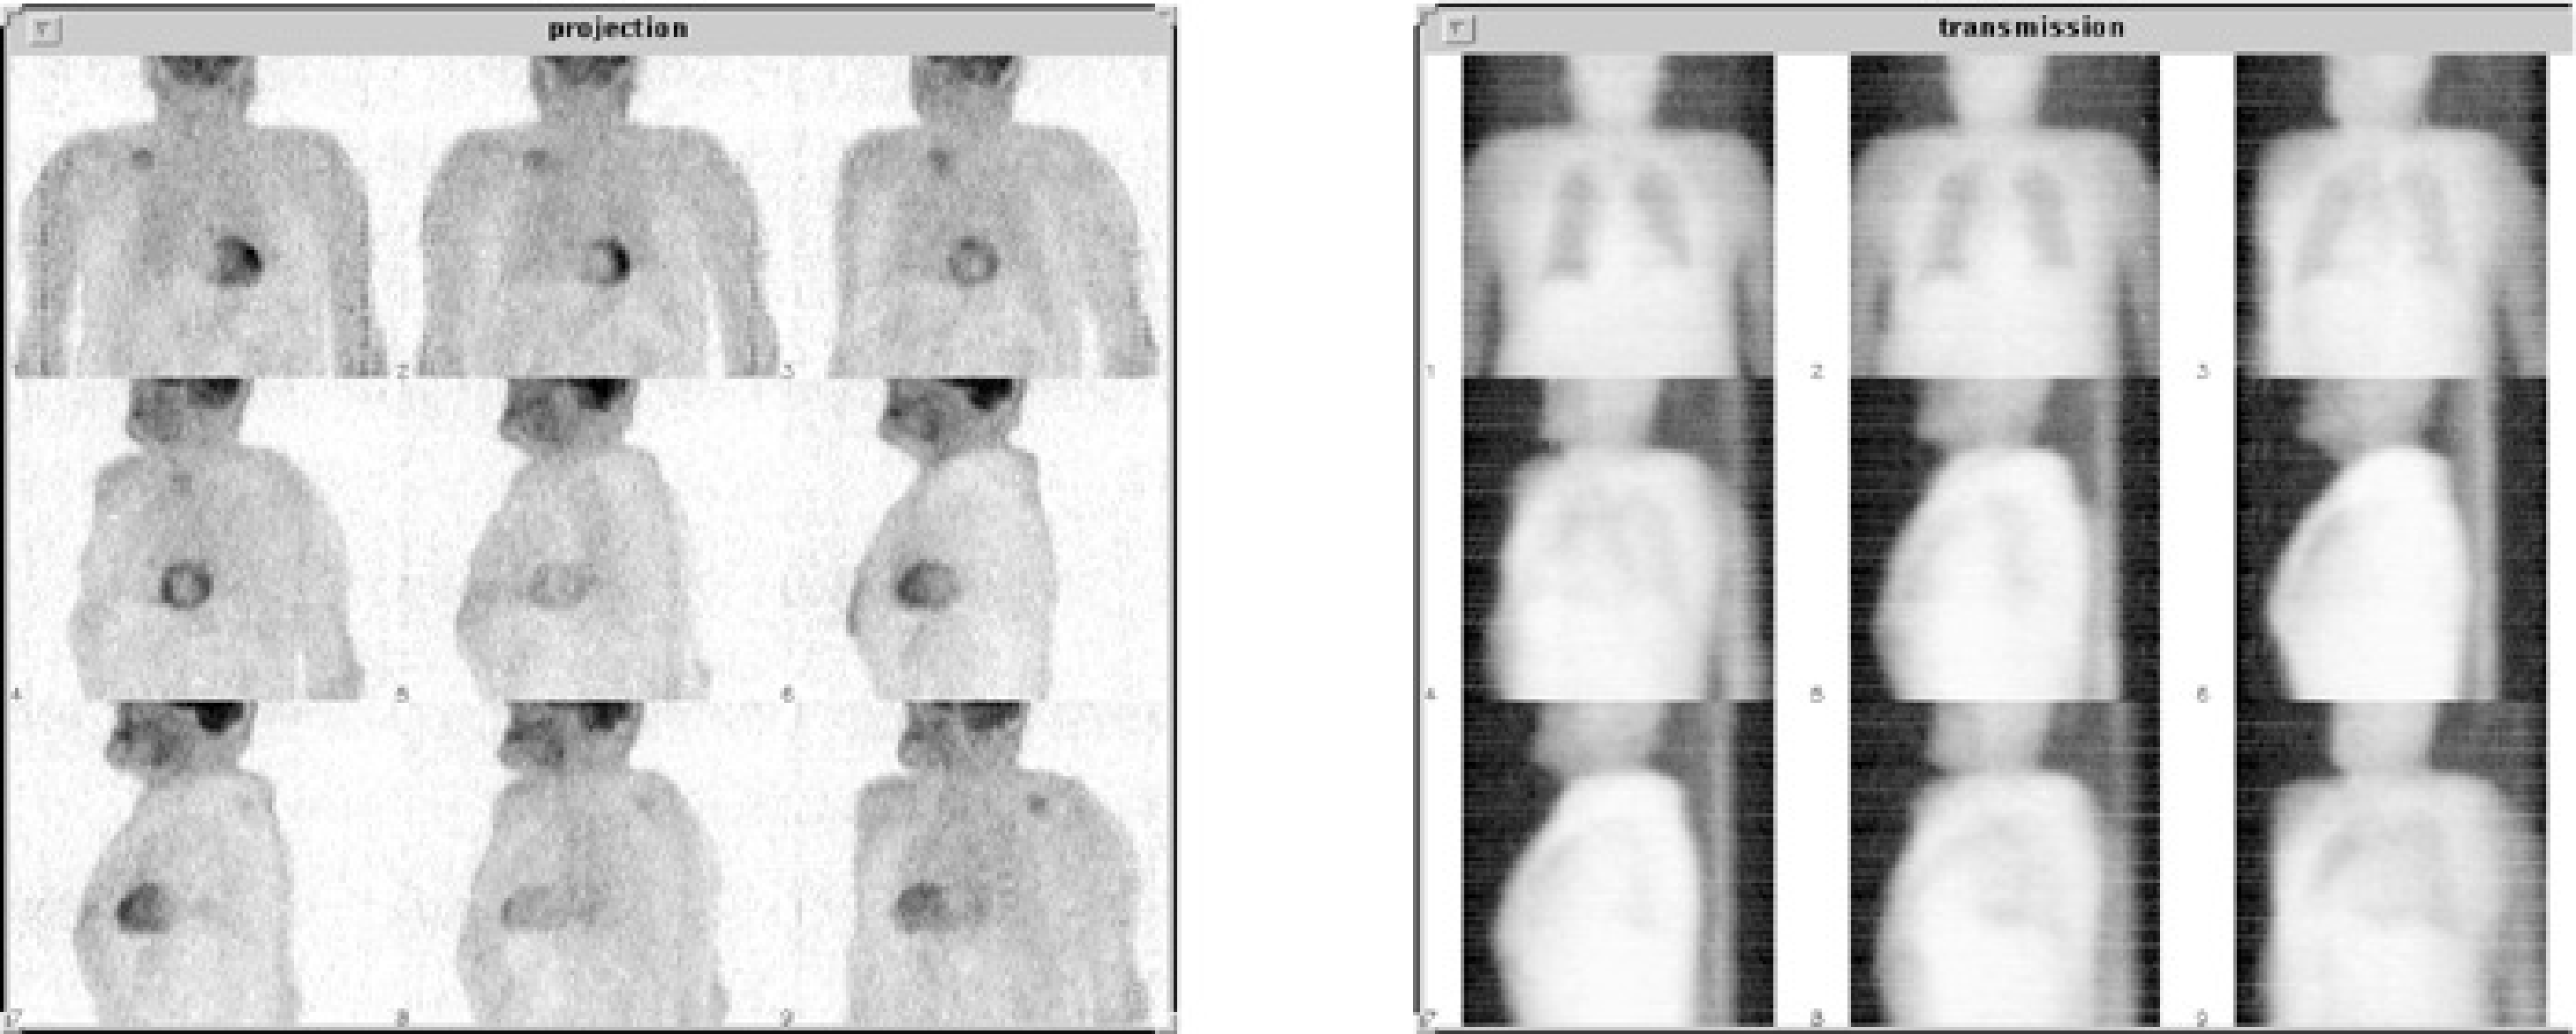
Figure 3:Left: emission PET projections. Right: transmission projections of the same patient.
For every projection line, we also need to know the number of photons emitted by the source (see equations (16) and (17)). These values are measured during a blank scan. The blank scan is identical to the transmission scan, except that there is nothing in the field of view. Blank scans can be acquired over night, so they do not increase the study duration. Long acquisition times can be used, to reduce the noise in the blank scan.
Transmission reconstruction
For PET, only the ratio between blank and transmission is required. However, it is useful to reconstruct the transmission image for two reasons. First, although the image quality is very poor compared to CT, it provides some anatomical reference which may be valuable to the physician. Second, the attenuation along a projection line may be computed from the reconstructed image. This improves the signal to noise ratio. Indeed, when computed from the reconstruction, the entire blank and transmission sinogram contribute to the estimated attenuation coefficient. In contrast, an estimate computed from the ratio of blank and transmission scans is based on a single blank and transmission pixel value.
For SPECT, the transmission measurement must be reconstructed, because the reconstruction values are required to compute the coefficient in (33) or in other iterative algorithms.
All what has been said about reconstruction of emission scans can be done for transmission scans as well. However, there is an important difference. In emission tomography, the raw data are a weighted sum of the unknown reconstruction values. In transmission tomography, the raw data are proportional to the exponent of such a weighted sum. As a result of this difference, the MLEM algorithm cannot be applied directly, so several new ones have been presented in recent literature. Similarly as in the emission case, one can use a non-trivial prior distribution for the reconstruction images. In that case, the reconstruction is called a maximum-a-posteriori algorithm or MAP-algorithm (see section Bayesian approach).
The prior is the probability we assign to the image Λ, independently of any measurement. To suppress the noise, the prior probability function is designed such that it takes a higher value for smoother images. This is typically done by computing the sum of all squared differences between neighboring pixels, but many other functions have been invented as well. Such functions have been successfully used, both for emission and transmission tomography. In the case of transmission tomography, we also have prior knowledge about the image values: the linear attenuation coefficient of human tissues is known. Thus, it makes sense to design prior functions that return a higher value when the pixel values are closer to the typical attenuation values encountered in the human body.
Figure 4 shows the reconstructions of a 10 min transmission scan. The same sinogram has been reconstructed with filtered backprojection, ML and MAP. Because the scan time is fairly long, image quality is reasonable for all algorithms.
Figure 5 shows the reconstructions of a 1 min transmission scan obtained with the same three algorithms. In this short scan, the noise is prominent. As a result, streak artifacts show up in the filtered backprojection image. The ML-image produces non-correlated noise with high amplitude. As argued in section Regularization, this can be expected, since the true number of photons attenuated during the experiment in every pixel is subject to statistical noise. And if that number is small, the relative noise amplitude is large. The MAP-reconstruction is much smoother, because the prior assigns a low probability to noisy solutions. This image is a compromise between what we know from the data and what we (believe to) know a priori.

Figure 4:Reconstruction of a PET transmission scan of 10 min. Left: filtered backprojection; Center: MLTR; Right: MAP (Maximum a posteriori reconstruction).

Figure 5:Reconstruction of a PET transmission scan of 1 min. Left: filtered backprojection; Center: MLTR; Right: MAP (Maximum a posteriori reconstruction).
Transmission scanning has never become very popular in SPECT, because the physicians felt that their diagnosis was not adversely affected by the attenuation-artifacts (i.e. artifacts caused by ignoring the attenuation) and because it increases the cost of the gamma camera. In PET, those artifacts tend to be more severe, and transmission scanning has been provided and used in almost all commercial PET systems. However, since the introduction of PET/CT, the CT image has been used for attenuation correction, and most PET/CT systems do no longer have the hardware for PET transmission scanning.
Combined PET/CT
The CT system
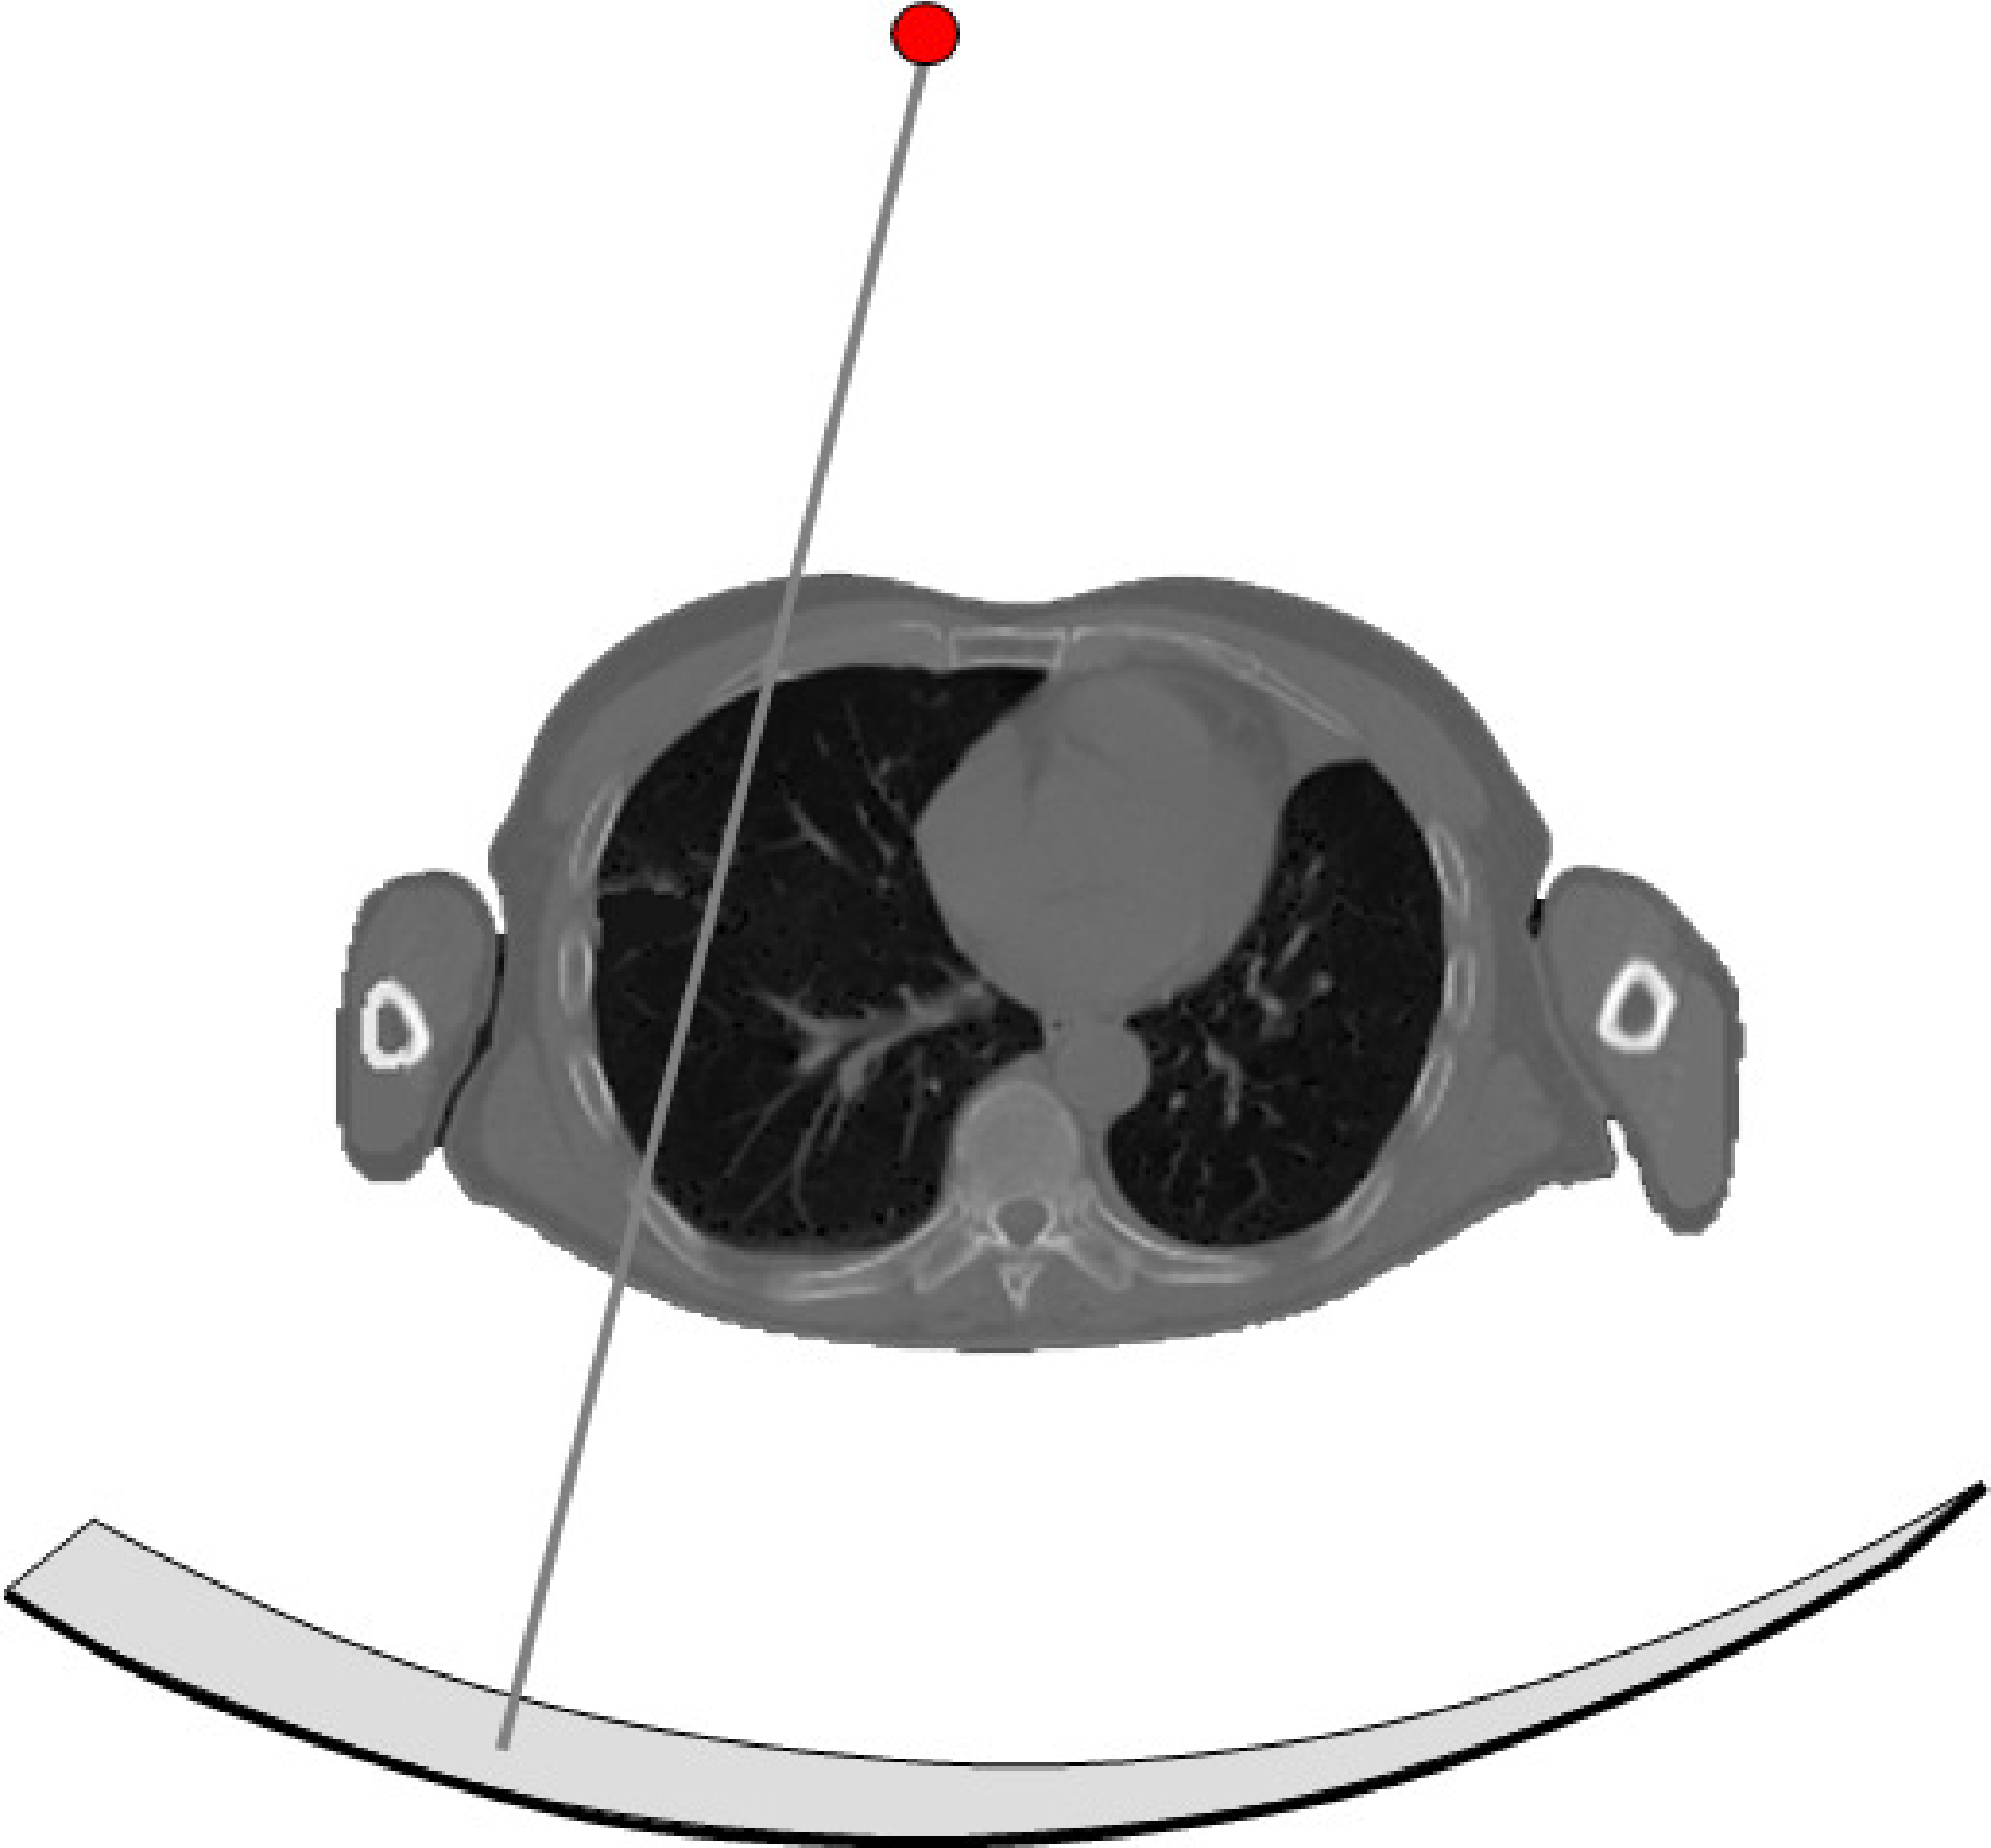
Figure 6:A CT system consists of a collimated X-ray tube and a detector mounted on a rotating gantry. The detector has tens to hundreds of rows, each consisting of about a thousand detector elements
The principle of the CT system (Figure 6) is similar to that of PET transmission scanning, but the implementation is far more sophisticated and performant. For the transmission source, an X-ray tube is used. A high voltage of kV (typically equals about 80-140 kV) frees electrons in the kathode and accelerates them, such that they hit the anode with a kinetic energy of keV per electron. That energy is converted mostly to heat, but also to X-rays (bremsstrahlung and characteristic X-rays). The X-ray tube is collimated, such that all the radiation is absorped except if it is propagating towards the detector.
The detector surface is cylindrical, with the X-ray tube located on the axis of the cylinder. In the axial direction it is several cm long, the transaxial size is about a meter to ensure minimal trunctation when imaging the human body. The detector consists of a matrix of detector elements, organized in tens up to hundreds of rows, each containing up to a thousend detector elements. Current CT-systems use integrating detectors: they measure the total energy incident on the detector during a small time interval.
During the calibration, blank scans (aka air scans) are acquired at different energies. As already explained above, a blank scan and transmission scan (acquired at the same energy) are combined to compute the total attenuation along a particular line:
where and are the position of the source and the detector on the projection line corresponding to detector element .
When the line integrals (2) are available, the attenuation image μ can be reconstructed, either analytically (with a filtered backprojection algorithm) or iteratively (e.g. with a maximum likelihood algorithm). The pixel values of the reconstructed image would then represent (approximately) the attenuation of the tissues at the average energy of the X-ray photons (typically around 70 keV). To make the image independent of the chosen energy of the X-ray tube, the image values are converted to so-called Hounsfield units (HU) as follows:
where represents the coordinate of the considered voxel in the CT image. Consequently, the attenuation of vacuum corresponds to -1000 HU, and the attenuation of water to 0 HU.
The PET/CT system
In oncology, patients often undergo a CT and a PET 18F-FDG scan. The CT-image provides very fine anatomical detail, but cannot easily differentiate malign tumors from necrotic or benign tissue. The PET-image shows regions with increased metabolic activity, but provides limited anatomical detail. Obviously, the physicians would like both at the same time.
Around 2000, the first PET/CT prototype system has been introduced. A PET-camera and a CT-scanner are combined in a single gantry and share the same patient bed (Figure 7). By scanning phantoms visible in both systems (e.g. radioactive point or rod sources) the geometrical aligment between both systems is determined. That ensures that for each CT-voxel the corresponding PET-voxel can be found.

Figure 7:A PET/CT system consists of a PET and a CT system, sharing the same patient table.
Typically, a patient examination starts with a helical CT-scan from the head to the pelvis, which is completed in about 15 seconds. Then the PET-scan is acquired: this involves about 7 acquisitions at subsequent bed positions, where each acquisition provides an image volume extending over 10 to 15 cm. At 2 to 4 minutes per bed position this requires about 15 to 30 min, so the whole examination would require about 20 to 35 min. Assuming that the patient does not move during the entire procedure, the two images are perfectly aligned, and the physicians can see the the function and anatomy at the same time, as illustrated in Figure 8.
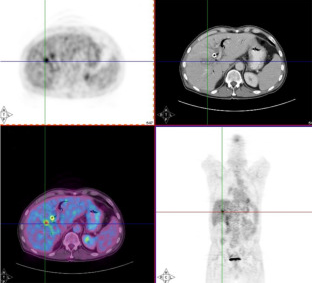
Figure 8:Images from a PET/CT system, allowing simultaneous inspection of anatomy and function.
It has been shown that this combined imaging improves the diagnostic procedure considerably, in particular in oncology, and the PET/CT system has been accepted with great enthousiasm. All PET-manufacturers offer PET/CT systems, and since 2006 it has even become virtually impossible to buy a PET-system without CT. Also SPECT-CT systems are being offered now, although they are not nearly as successful (yet?) as the PET/CT systems.
CT-based attenuation correction
In the beginning, the PET in the PET/CT system still had a transmission source, allowing a comparison between the PET-transmission image (using a positron emitter for transmission source) and the CT-image. However, PET-transmission scanning is slow and current systems use the CT-image for the PET attenuation correction.
An obvious advantage of the CT image is that it is nearly noise-free: there are millions of photons per detector element, whereas a PET-transmission scan typically has a few hundered per detector. But there are problems too. The two most important problems are the conversion of the linear attenuation coefficients and dealing with patient motion.
Conversion of attenuation coefficients
The attenuation of photons in CT and PET is dominated by the photo-electric and Compton interactions. The photo-electric effect varies approximately with , while the Compton effect hardly varies with photon energy and atomic number . The photons produced by positron-electron annihilation have an energy of 511 keV. However, the radiation used in a CT-scanner is very different, so we will have to convert the CT-attenuation values from the CT energy to 511 keV, if we want to use them for PET attenuation coefficients.
The CT produces radiation by bombarding an anode with electrons in a vacuum tube. The electrons are accelerated with an electric field, which can usually be adjusted in a range of about 80 to 140 kV, so they acquire a kinetic energy of 80 to 140 keV. They hit the anode where they are stopped. Part of their energy is dissipated as Bremsstrahlung, which produces a continuous spectrum. In addition, the electrons may also knock anode electrons out of their shell (e.g. the K-shell). A higher shell electron (e.g. from the L-shell) will then move to the vacant lower energy state, producing a characteristic radiation of . So if the CT voltage is set to 140 kV, the CT-tube produces radiation with a spectrum between 0 and 140 keV (Figure 9).
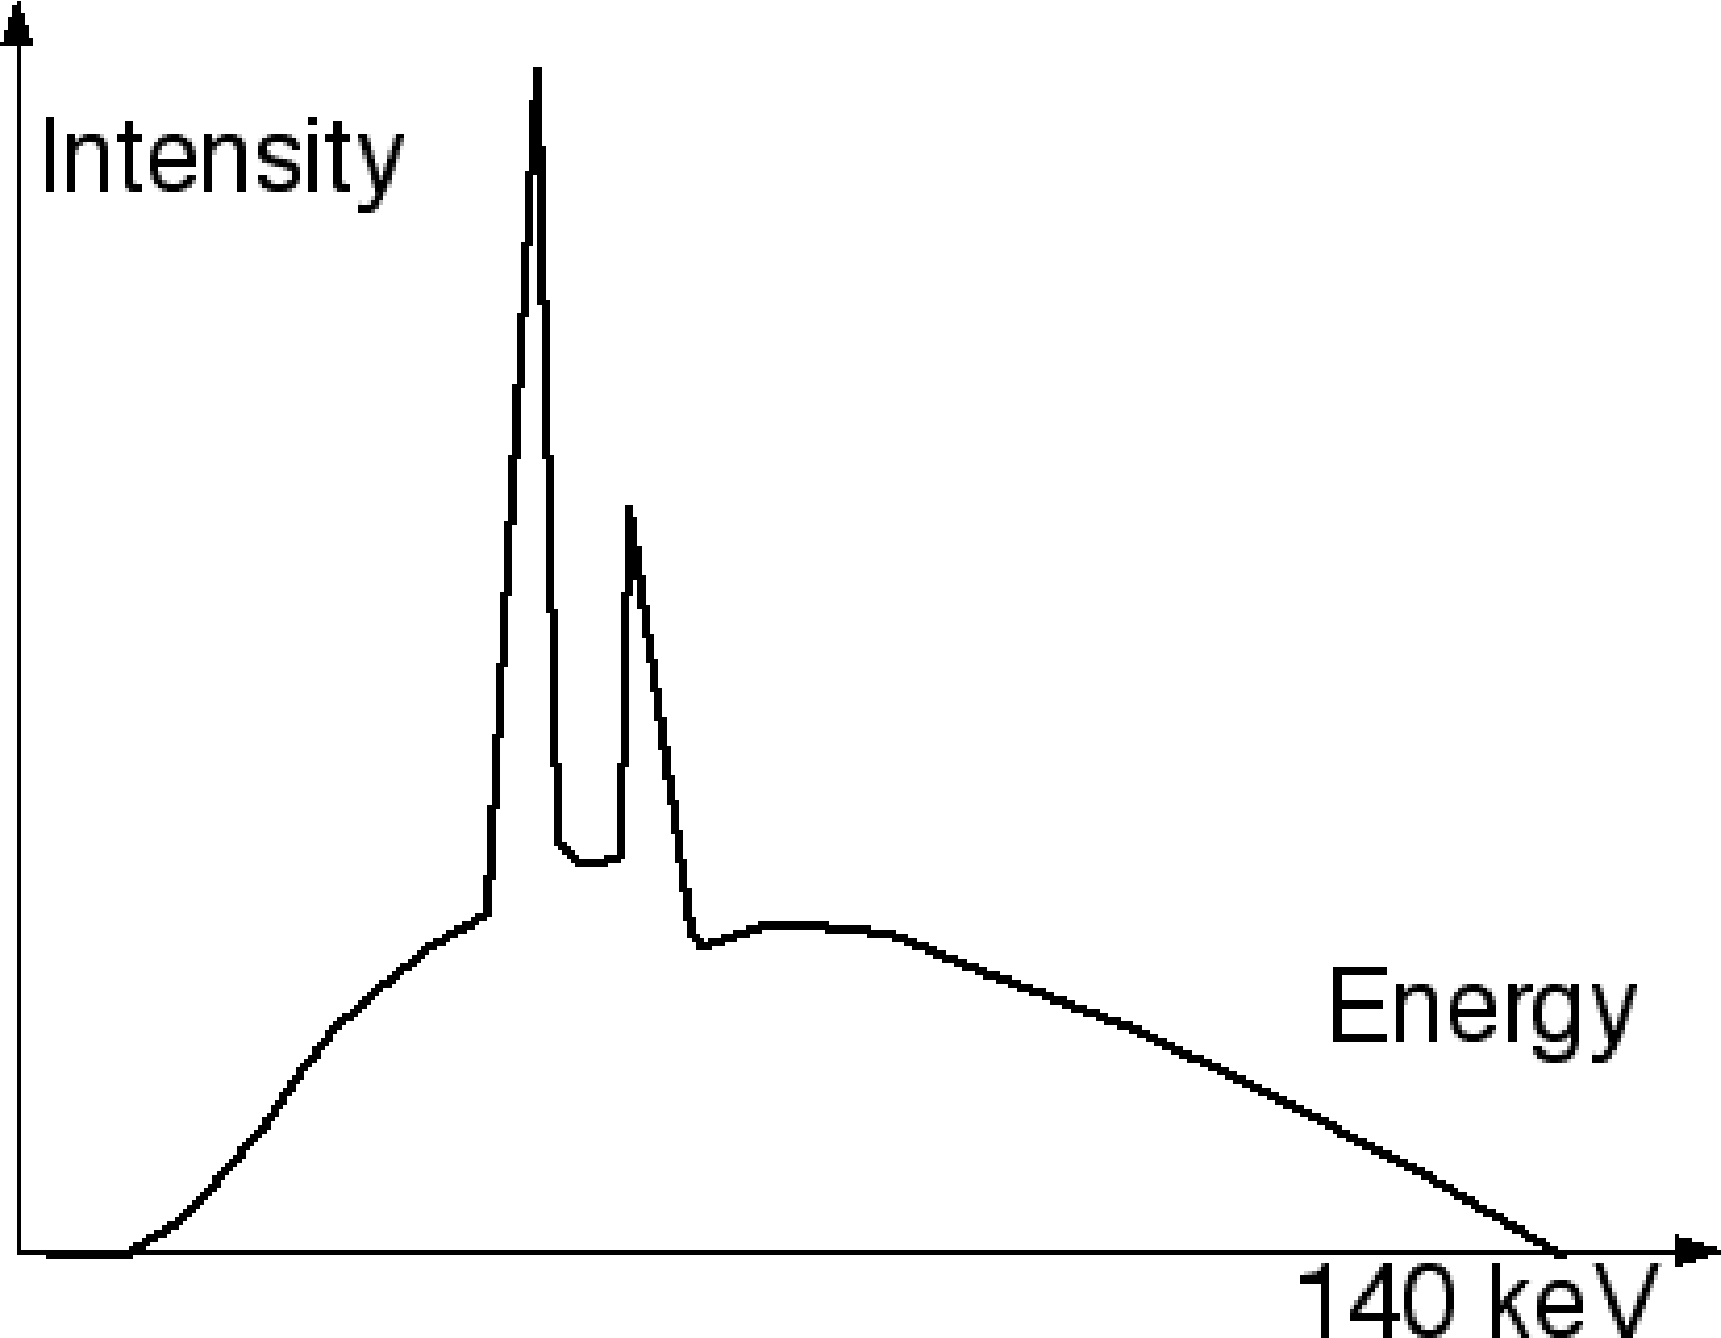
Figure 9:Typical CT spectrum with continuous Bremsstrahlung and a few characteristic radiation peaks.
Human tissue consists mostly of very light atoms. For attenuation correction, these tissues can be well approximated as mixtures of air or vacuum (no attenuation) and water. The attenuation of water is about 0.096/cm at 511 keV, and about 0.19 at 70 keV, which is the “effective” energy of the CT-spectrum. Assuming that everything in the human body is a mixture of water and vacuum, we only need a single scale factor equal to 0.096 / 0.19. But of course, there is also bone. One can apply the same trick with good approximation: we regard everything denser than water as a mixture between water and bone. Dense bone has an attenuation of about 0.17/cm at 511 keV, and about 0.44/cm at 70 keV. This yields the piecewise linear conversion function shown in Figure 10.
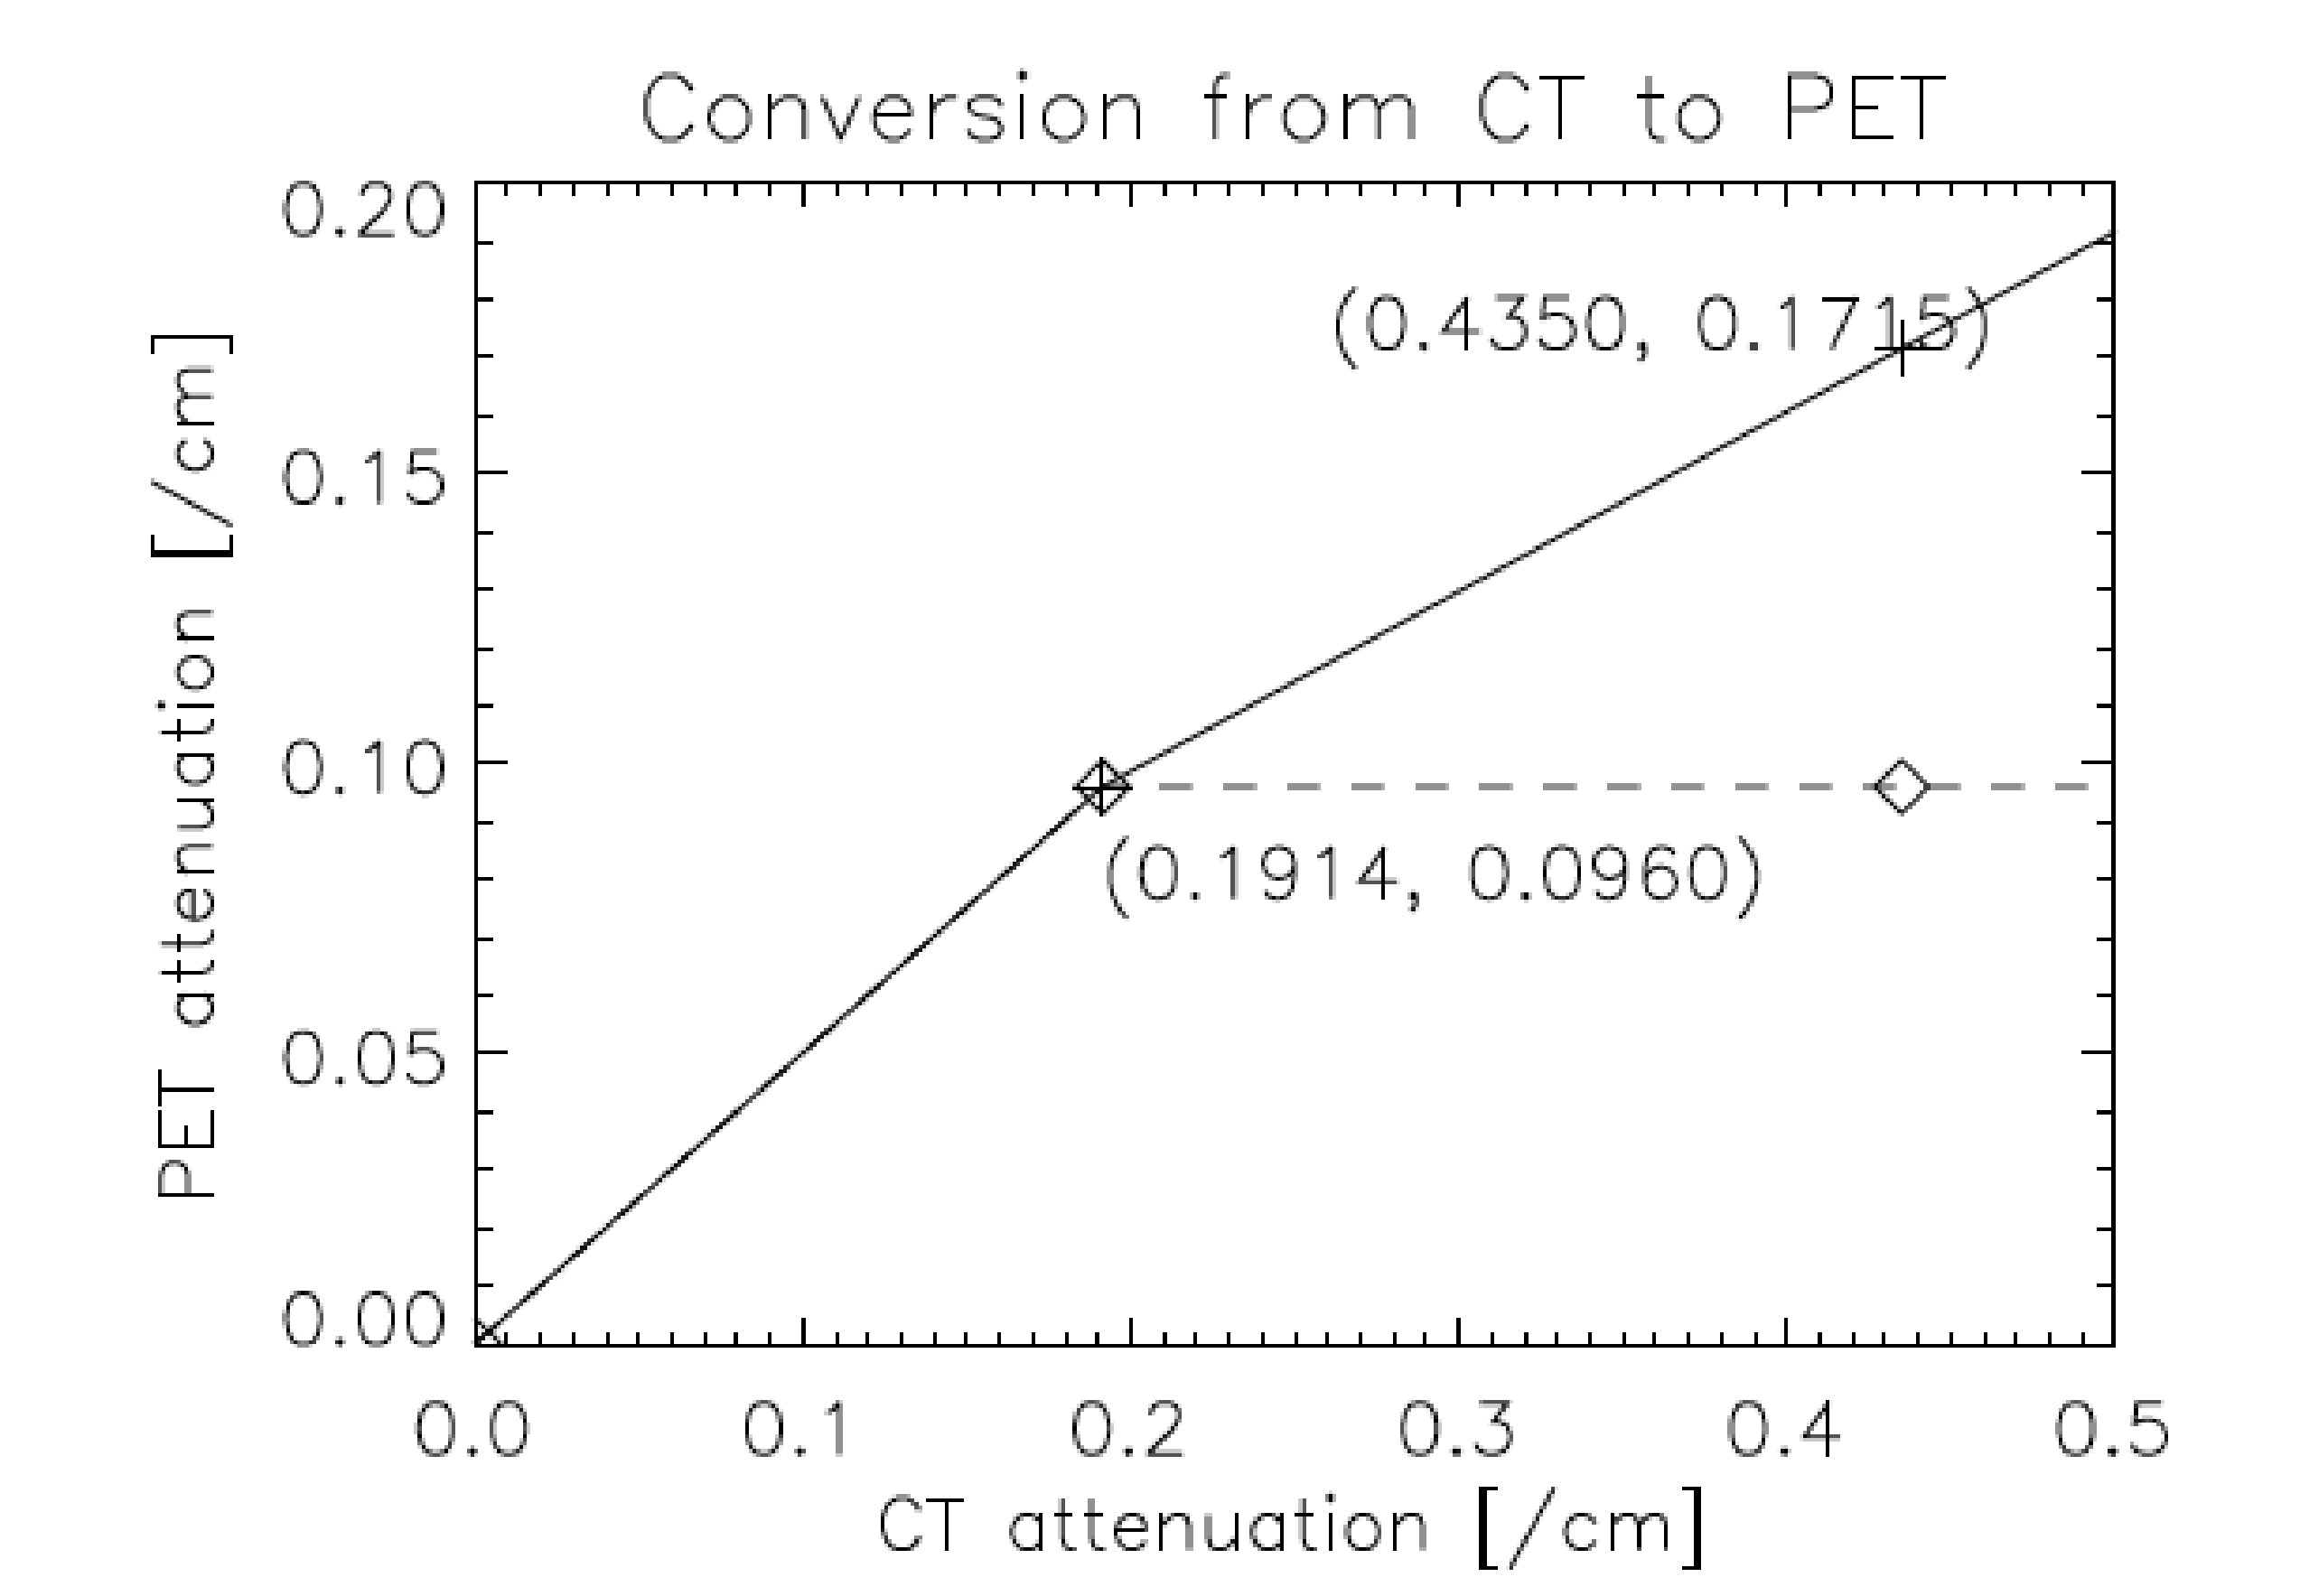
Figure 10:Piecewise linear conversion typically used in PET/CT software to move attenuation coefficients from 70 to 511 keV.
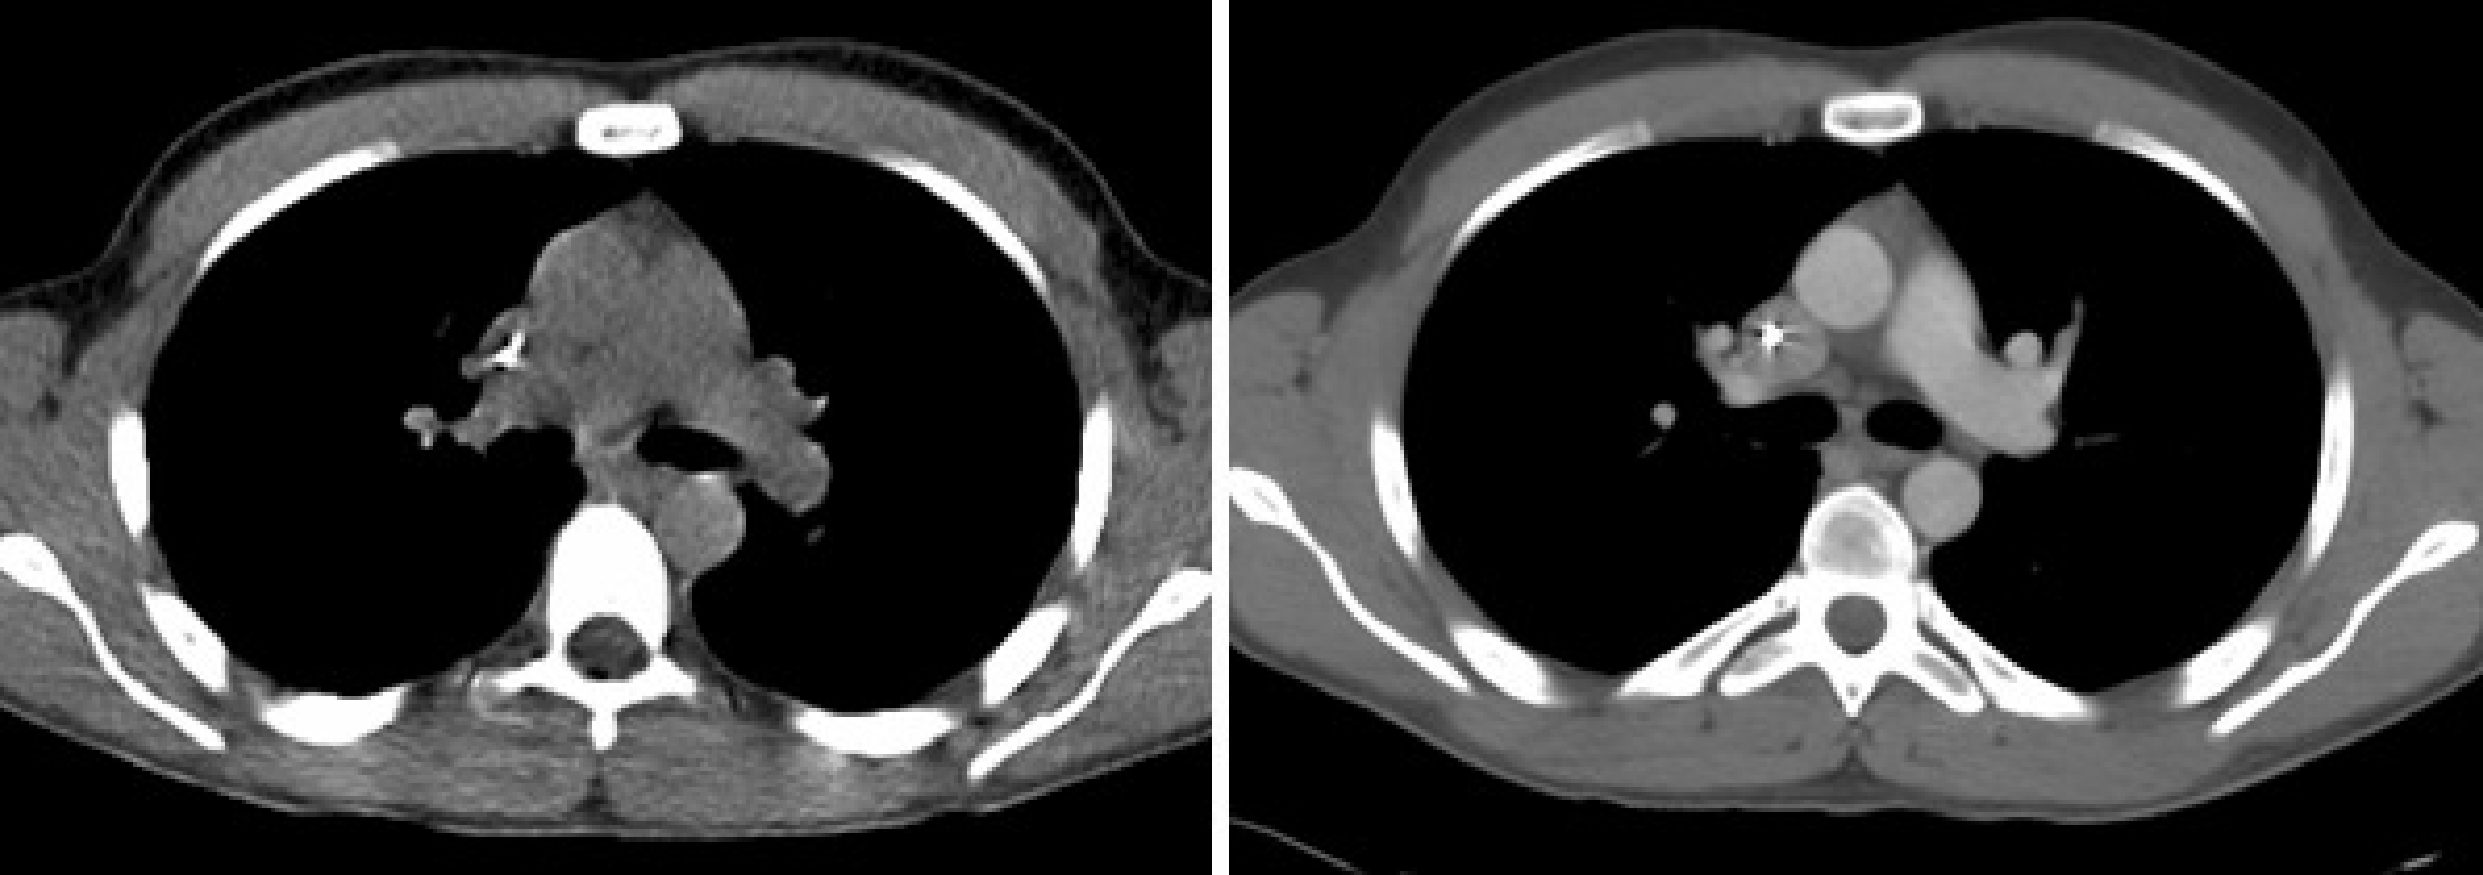
Figure 11:Left: CT image, acquisition with 30 mAs and no contrast. Right: CT image, acquisition with 140 mAs and intravenously injected contrast agent.
This scaling works reasonably well, except if a contrast agent is used during a diagnostic CT-scan. Contrast agents are used to improve the diagnostic value of the CT-image. Often a contrast agent is injected intravenously to obtain a better outline of well perfused regions. This is illustrated in Figure 11, which compares a CT image acquired with lower radiation dose and no contrast, to an image obtained with a higher radiation and intravenous contrast. Other contrast agents have to be taken orally, and are used to obtain a better visualization of the digestive tract. These contrast agents usually contain iodine, which has very high attenuation near 70 keV due to photo-electric effect (which is why they are effective for CT-imaging), but the attenuation is hardly higher than that of water at 511 keV (mostly Compton interactions). As a result, the piecewise conversion produces an overestimation of the PET-attenuation in regions with significant contrast uptake. This matter is currently being investigated, no standard solution exists.
A related problem is that of metal artifacts. Because the attenuation of metal prostheses or dental fillings is extremely high at 70 keV, such objects can attenuate almost all photons. The number of acquired photons is in the denominator of equation (16), so the CT-reconstruction gets into problems when the number of acquired photons goes to zero. This numerical instability can produce artifacts in the CT-reconstruction, which will propagate into the PET image via the CT-based attenuation correction. (Partial) solutions exist, but currently, they are not yet included in commercial CT-software.
Geometrical calibration
To make sure that the PET and CT images are well aligned (Figure 8), careful geometrical calibration of the two systems is mandatory. This is done by acquiring a phantom which is clearly visible in both modalities. E.g., one of the vendors (Siemens) uses a phantom consisting of two non-coplanar rod sources. These rods are a made of stainless steel, have a diameter of about a mm and are filled with 68Ge. These rods are clearly visible in both PET and CT, and it is relatively easy to compute the transformation (6 degrees of freedom) required to accurately align the images. The same transformation is then applied to align the patient images. This transformation usually remains valid until something changes, which is typically the case when something must be repaired (X-ray tube replacement, PET detector replacement etc.). For such actions, the two systems are pulled apart. After combining them again, the spatial alignment could be change by a few mm, so a new calibration is then required.
Patient motion
The time between the helical CT-scan and the last PET-scan is about half an hour. That is a long time to ly motionless, and in most PET/CT images one can see small positional mismatches due to patient motion. A similar mismatch is caused by breathing. The CT-scan is very fast compared to the breathing cycle, and essentially takes an image at one point of that cycle. In contrast, the PET-scan runs for a few minutes per bed position, and produces an image averaged over the breathing cycle. This causes motion blur in the PET image, and a registration mismatch with the corresponding CT image. The mismatch may yield attenuation correction artifacts in the PET image. An example of such an artifact is shown in Figure 12. The CT has been taken at maximum inhalation, causing the lungs in the CT-image to be larger than in the PET image. The patient increased his lung size mostly by a displacement of the diaphragm. The CT-based attenuation correction underestimates the attenuation at the dome of the liver (because the computer thinks this part has undergone lung attenuation, and the lungs are far less dense than the liver). This undercorrection, then, yields a decrease of apparent tracer uptake, making the activity in this part of the liver similar to that in the lung. As a result, the liver tumor seems to show up in the lung. The figure also shows an image obtained with attenuation correction based on a (well matched) transmission scan with a positron emitter, clearly showing that the tumor is in the liver.
Another example is given in Figure 13. Because of potential attenuation correction artifacts, it is good practice to always make a reconstruction of the PET image without attenuation correction (Figure 13.A). This image has of course always many artifacts too, but these artifacts tend to be similar in all patients, so one can learn to read such images. Comparison of the image with and without attenuation correction may reveal subtle attenuation correction artifacts, which otherwise might lead to the wrong diagnosis. Such an artifact is present in the brain in Figure 13.C, which shows a left-right asymmetry caused by a motion artifact.
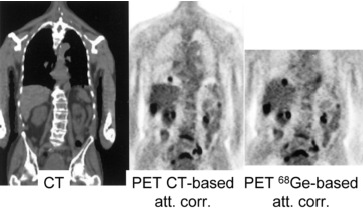
Figure 12:PET/CT attenuation artifact due to breathing. The tumor is really located in the liver, but the mismatch with the CT and the resulting attenuation correction errors make it show up in the lung.This figure is from a paper by Sarikaya, Yeung, Erdi and Larson, Clinical Nuclear Medicine, 2003; 11: 943
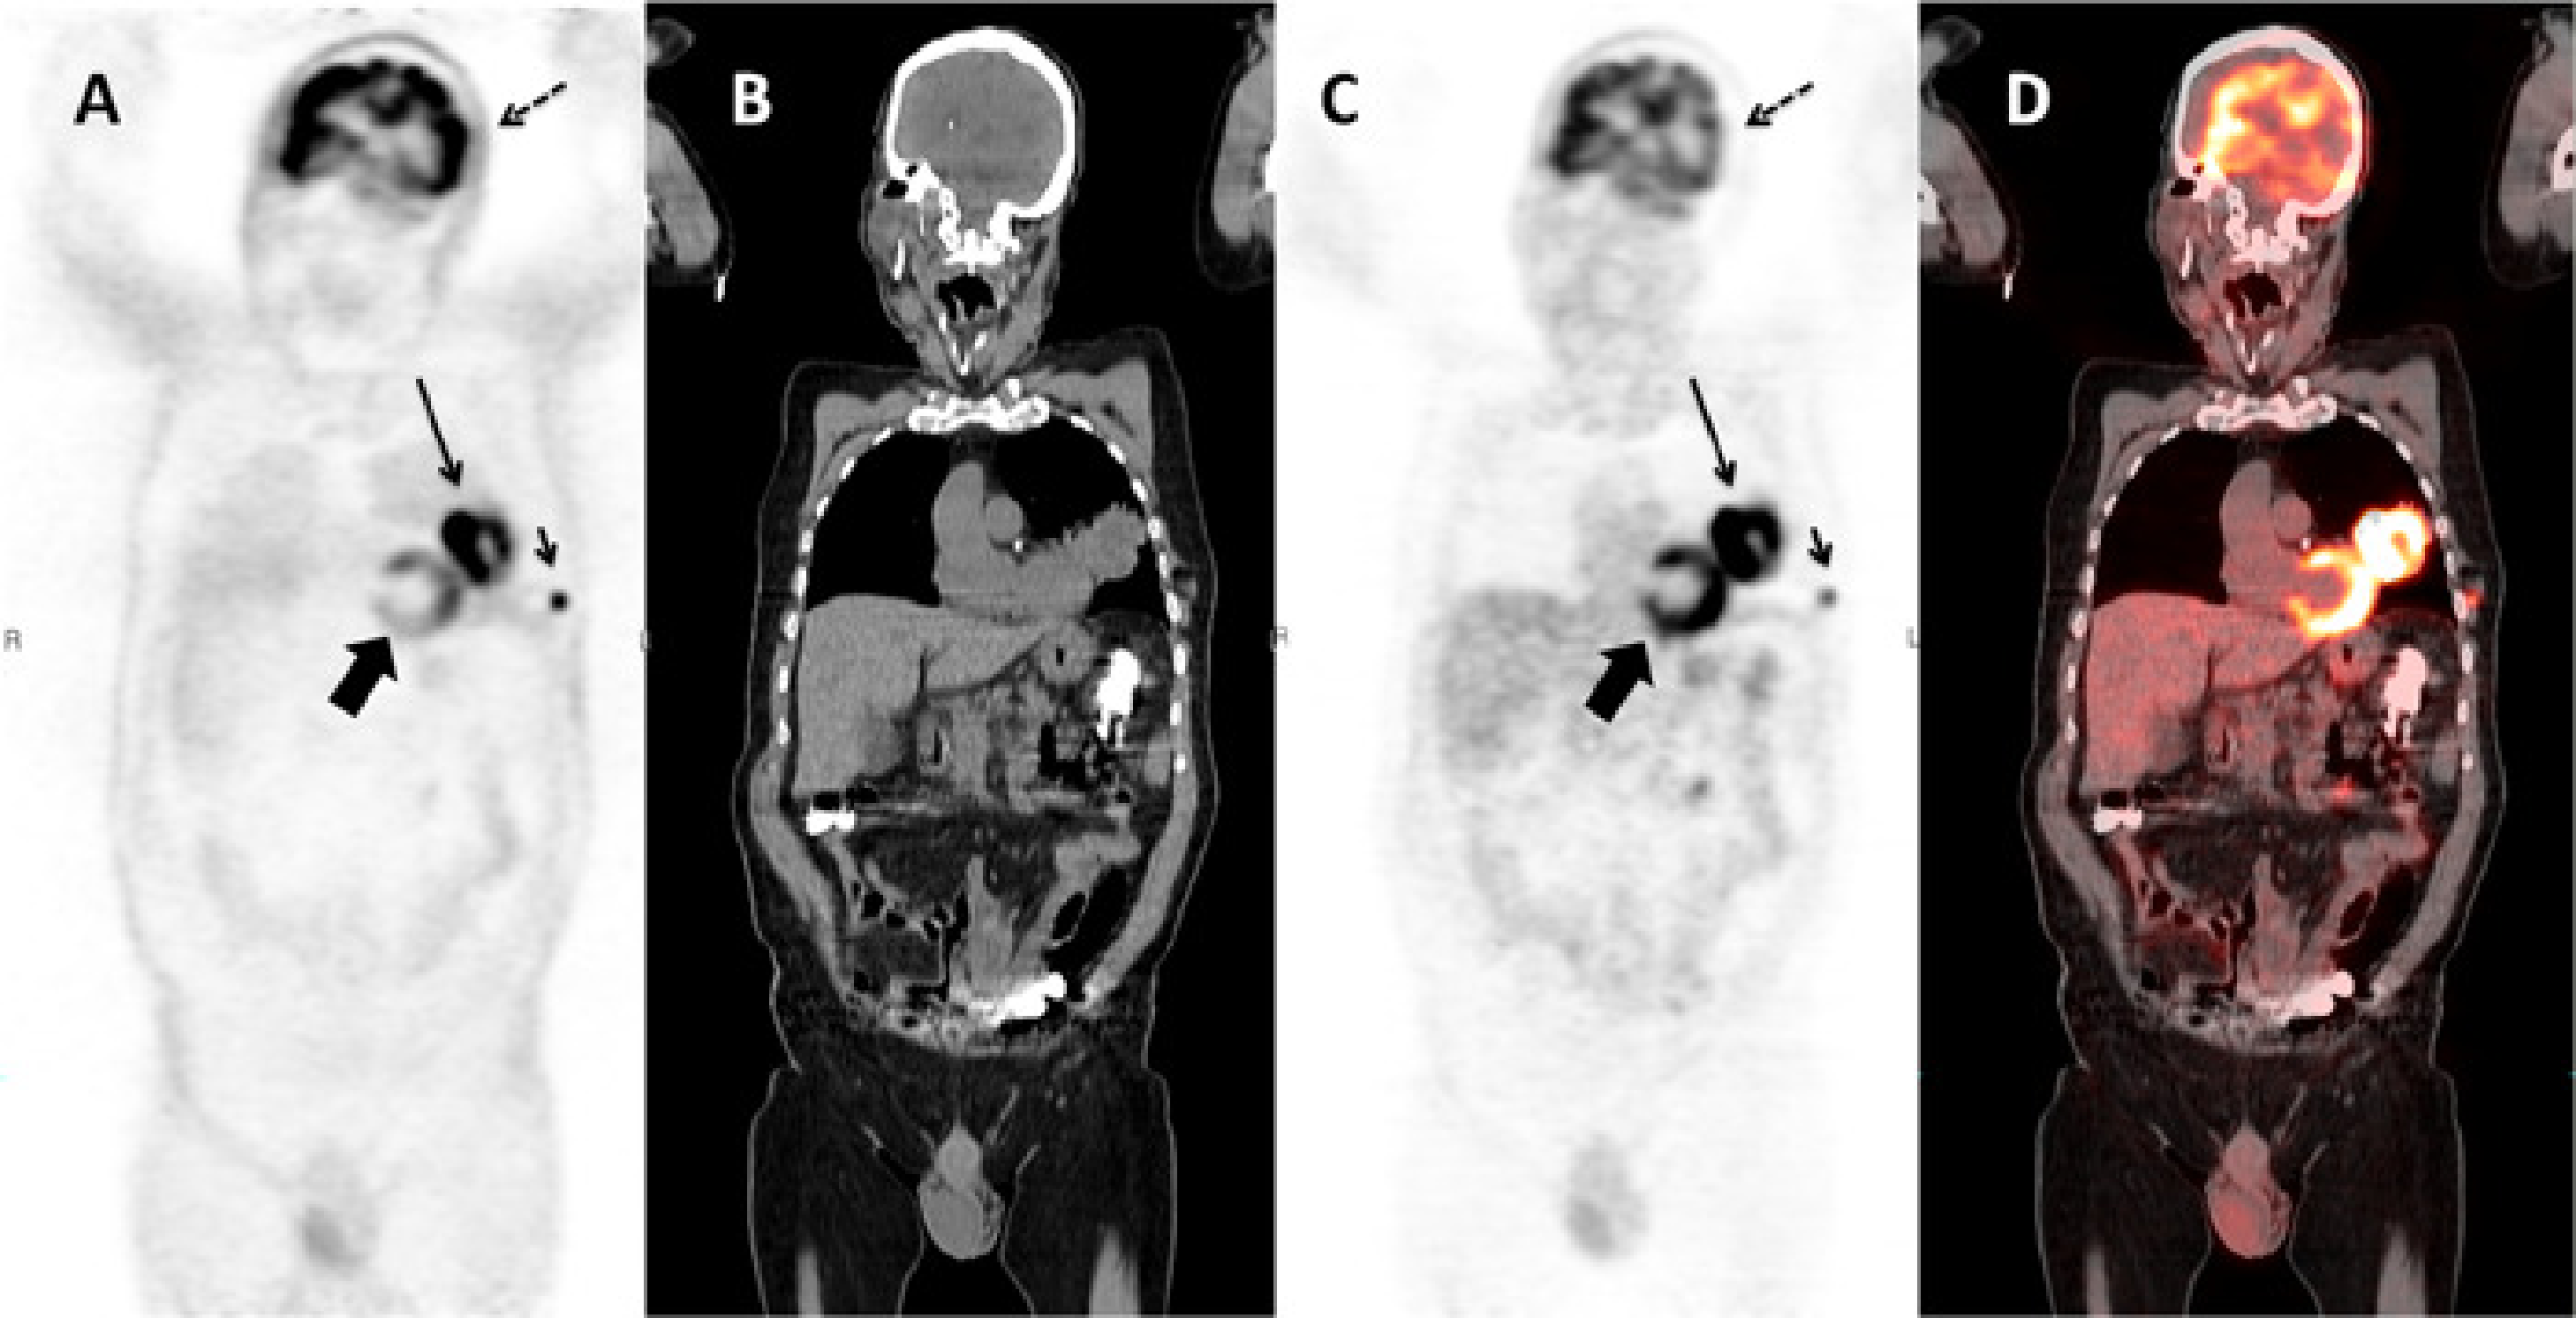
Figure 13:Coronal slice of a whole body PET/CT study reconstructed without (A) and with (C) attenuation correction based on a whole body CT (B). PET and CT are combined in a fusion image (D). The relative intensity of the subcutaneous metastasis (small arrow) compared to the primary tumor (large arrow) is much higher in the non corrected image than in the corrected one, because the activity in this peripheral lesion is much less attenuated than the activity in the primary tumor. A striking artifact in (A) is the apparent high uptake in the skin and the lungs. Note also that regions of homogenous uptake, such as the heart (thick arrow), are no longer homogenous, but show a gradient. The uptake in the left side of the brain (dotted arrow) is apparently lower than in the contralateral one in (C). The fusion image shows that the head did move between the acquisition of the CT and the emission data, resulting in an apparent decrease in activity in the left side of the brain due errors in the attenuation correction.
The correction of these artifacts is a current research topics, no standard solutions exist.