The photomultiplier tubes are analog devices, with characteristics that are influenced by the age and the history of the device. To produce correct images, some corrections are applied (section Other corrections). The most important are the linearity correction and the energy correction. In most cameras, there is an additional correction, called the uniformity correction, taking care of remaining second order deviations. It is important to keep on eye on the camera performance and tune it every now and then. Failure to do so will lead to gradual deterioration of image quality.
When a camera is first installed, the client tests it extensively to verify that the system meets all required specifications (the acceptance test). The National Electrical Manufacturers Association (NEMA, “national” is the USA here) has defined standard protocols to measure the specifications. The standards are widely accepted, such that specifications from different vendors can be compared, and that discussions between customers and companies about acceptance test procedures can be avoided. You can find information on http://www.nema.org.
This chapter gives an overview of tests which provide valuable information on camera performance. Many of these tests can be done quantitatively: they provide a number. It is very useful to store the numbers and plot them as a function of time: this helps detecting problems early, since gradual deterioration of performance is detected on the curve even before the performance deteriorates beyond the specifications.
Quality control can be tedious sometimes, and it is not productive on the short term: it costs time, and if you find an error, it also costs money. Most of the time, the camera is working well, so if you assume that the camera is working fine, you are probably right and you save time. This is why a quality control program needs continuous monitoring: if you don’t insist on quality control measurements, the QC-program will silently die, and image quality will slowly deteriorate.
Gamma camera
For gamma camera quality control and acceptance testing, the Nederlandse Vereniging voor Nucleaire Geneeskunde has published a very useful book HY Oei et al. (n.d.). It provides detailed recipes for applying the measurement and processing procedures, but does not attempt to explain it, the reader is supposed to be familiar with nuclear medicine. These explanations can be found in “het Leerboek Nucleaire Geneeskunde” JAJ Camps et al. (n.d.).
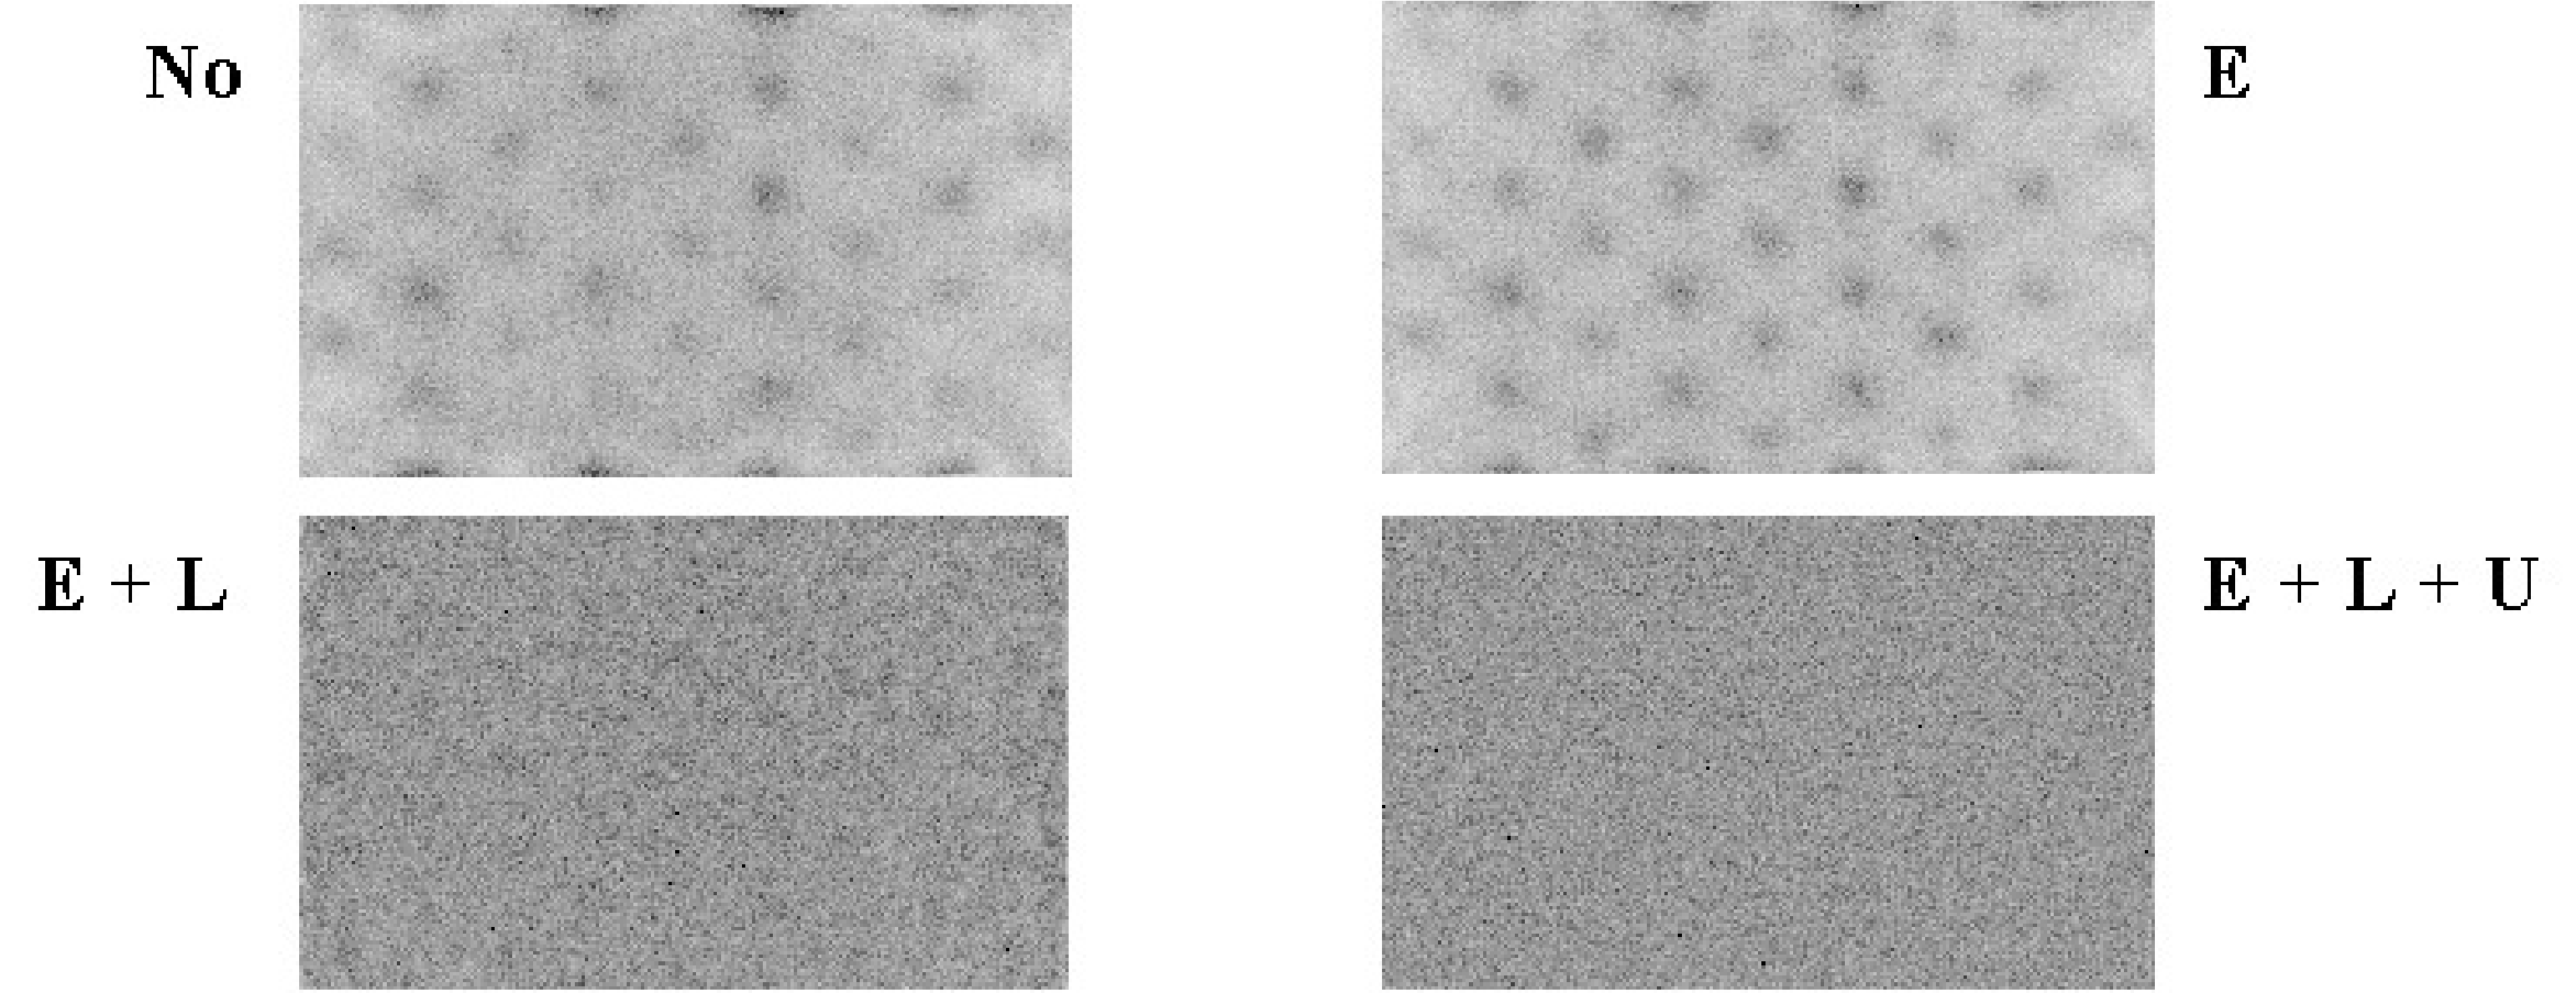
Figure 1:Image of a uniform phantom. E = energy correction, L = linearity correction, U = uniformity correction.
Figure 1 shows the influence of the corrections on the image of a uniform phantom. Without any correction, the photomultipliers are clearly visible as spots of increased intensity. After energy correction this is still the case, but the response of the PMTs is more uniform. When in addition linearity correction is applied, the image is uniform, except for Poisson noise. Uniformity correction produces a marginal improvement which is hardly visible.
For most properties, specifications are supplied for the UFOV (usable field of view) and the CFOV (central field of view). The reason is that performance near the edges is always slightly inferior to performance in the center. Near the edges, the scintillation point is not nicely symmetrically surrounded by (nearly) identical PMTs. As a result, deviations are larger and much stronger corrections are needed, unavoidably leading to some degradation. The width of the CFOV is 75% of the UFOV width, both in and direction.
Quality control typically involves
daily visual verification of image uniformity,
weekly quantitative uniformity testing,
monthly spatial resolution testing
extensive testing every year or after major interventions.
The scheme can be adapted according to the strengths and weaknesses of the systems.
Planar imaging
Uniformity
Uniformity is evaluated by acquiring a uniform image. As a phantom, either a point source at large distance is measured without collimator, or a uniform sheet source is put on the collimator. It is recommended to do a quick uniformity test in the morning, to make sure that the camera seems to work fine before you start imaging the first patient. Figure 2 shows a sheet source image on a camera with a defect photomultiplier. Of course, you do not want to discover such a defect with a patient image.
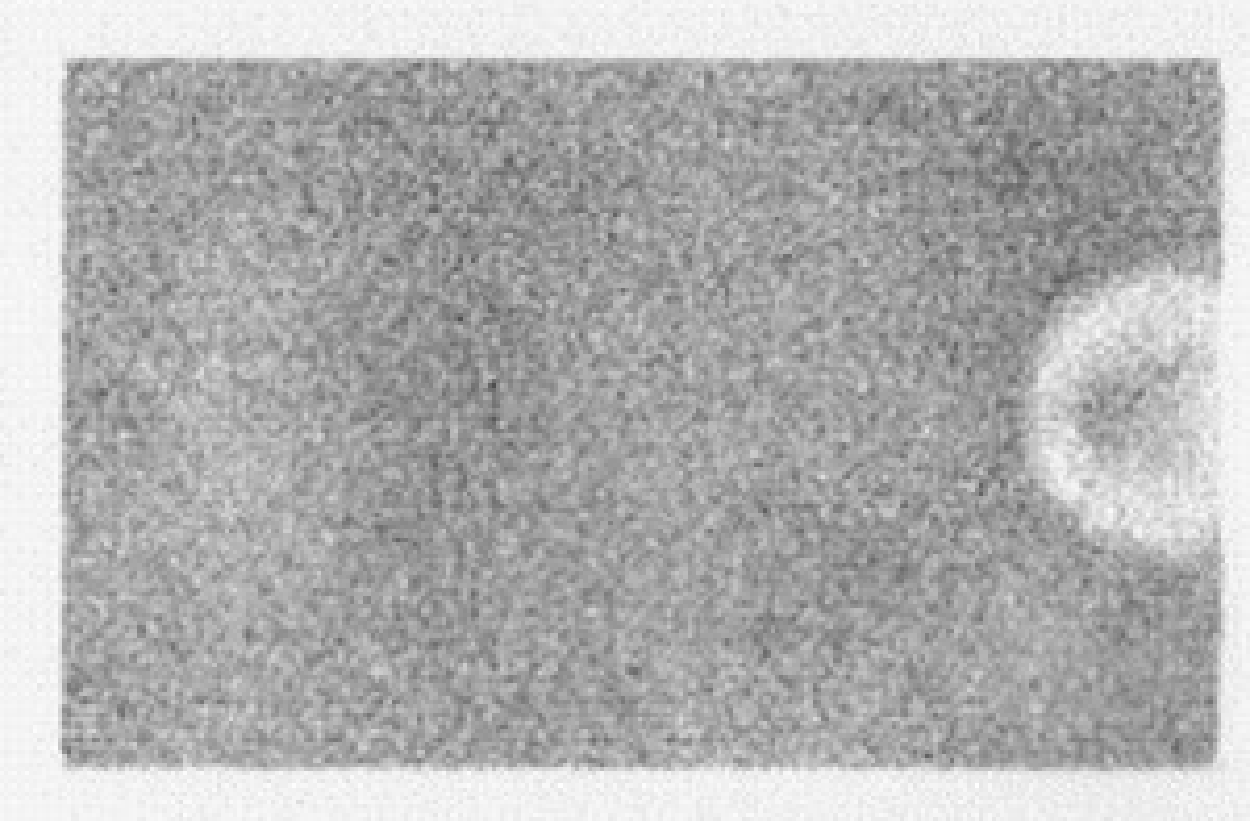
Figure 2:Uniform image acquired on a gamma camera with a dead photomultiplier.
For quantitative analysis, the influence of Poisson noise must be minimized by acquiring a large amount of counts (typically 10000) per pixel. Acquisition time will be in the order of an hour. Two parameters are computed from an image reduced to 64 × 64 pixels:
where the regional uniformity is computed by applying (2) to a small line interval containing only 5 pixels, and this for all possible vertical and horizontal line intervals. The differential uniformity is always a bit smaller than the integral uniformity, and insensitive to gradual changes in image intensity.
In an image of 64 × 64 with 10000 counts per pixel, the integral uniformity due to Poisson noise only is about 4%, typical specifications are a bit larger, e.g. 4.5%.
To acquire a uniformity correction matrix, typically 45000 counts per pixel are acquired. It is important that the camera is in good shape when a uniformity correction matrix is produced. Figure 3 shows a flood source image acquired on a camera with a linearity correction problem. The linearity problem causes deformations in the image: counts are mispositioned. In a uniform image this leads to non-uniformities, in a line source image to deformations of the line. If we now acquire a uniformity correction matrix, the corrected flood image will of course be uniform. However, the line source image will still be deformed, and in addition the intensities of the deformed line will become worse if we apply the correction matrix! If uniformity is poor after linearity and energy correction, do not fix it with uniformity correction. Instead, try to figure out what happens or call the service people from the company.
The uniformity test is sensitive to most of the things that can go wrong with a camera, but not all. One undetected problem is deterioration of the pixel size, which stretches or shrinks the image in or direction.

Figure 3:Flood source (= uniform sheet source) image acquired on a dual head gamma camera, with a linearity correction problem in head 1 (left)
Pixel size
The and coordinates are computed according to equation (1), so they are affected by the PMT characteristics, the amplification of the analogue signals prior to A/D conversion and possibly by the energy of the incoming photon, since that affects the PMT outputs.
Measuring the pixel size is simple: put two point sources at a known distance, acquire an image and measure the distance in the image. Sub-pixel accuracy is obtained by computing the mass center of the point source response. The precision will be better for larger distances. The pixel size must be measured in and in direction, since usually each direction has its own amplifiers.
Figure 4 shows an example where the -amplifier gain is wrong for one of the heads of a dual head camera (the -gain is better but not perfect either). The error is found from this dot phantom measurement by superimposing both images. Since the images are recorded simultaneously, the dots from one head should fit those from the other. Because of the invalid -pixel size in one of the heads there is position dependent axial blurring (i.e. along the y-axis), which is worse for larger values.
It is useful to verify if the pixel size is independent of the energy. This can be done with a 67Ga point source, which emits photons of 93, 184 and 296 keV. Using three appropriate energy windows, three point source images are obtained. The points should coincide when the images are superimposed. Repeat the measurement at a few different positions (or use multiple point sources).

Figure 4:Images of a dot phantom acquired on a dual head camera with a gain problem. Left: image acquired on head 1. Center: image simultaneously acquired on head 2. Right: superimposed images: head1 + mirror image of head2. The superimposed image is blurred because the heads have a different pixel size.
Spatial resolution
In theory, one could measure the FWHM of the PSF directly from a point source measurement. However, a point source affects only a few pixels, so the FWHM cannot be derived with good accuracy. Alternatively, one can derive it from line source measurements. The line spread function is the integral of the point spread function, since a line consists of many points on a row:
Usually, the PSF can be well approximated as a Gaussian curve. The LSF is then easy to compute:
In these equations, we have assumed that the line coincides with the -axis. So it is reasonable to assume that the FWHM of the LSF is the same as that of the PSF. On a single LSF, several independent FWHM measurements can be done and averaged to improve accuracy. Alternatively, if the line is positioned nicely in the or direction, one can first compute an average one-dimensional profile by summing image columns or rows and use that for LSF computations. Again, measurements for and must be made because the resolution can become anisotropic.
Energy resolution
Most gamma cameras can display the measured energy spectrum. Because it is not always clear where the origin of the energy axis is located, it is save to use two sources with a different energy, and calibrate the axis from the measurement. E.g. Figure 5 shows two spectra, one for 99mTc (peak at 140 keV) and the other one for 57Co (peak at 122 keV). The distance between the two peaks is 18 keV, and can directly be compared to the FWHM of the two spectra.
The FWHM is usually specified relative to the peak energy. So a FWHM of 10% for 99mTc means 14 keV.
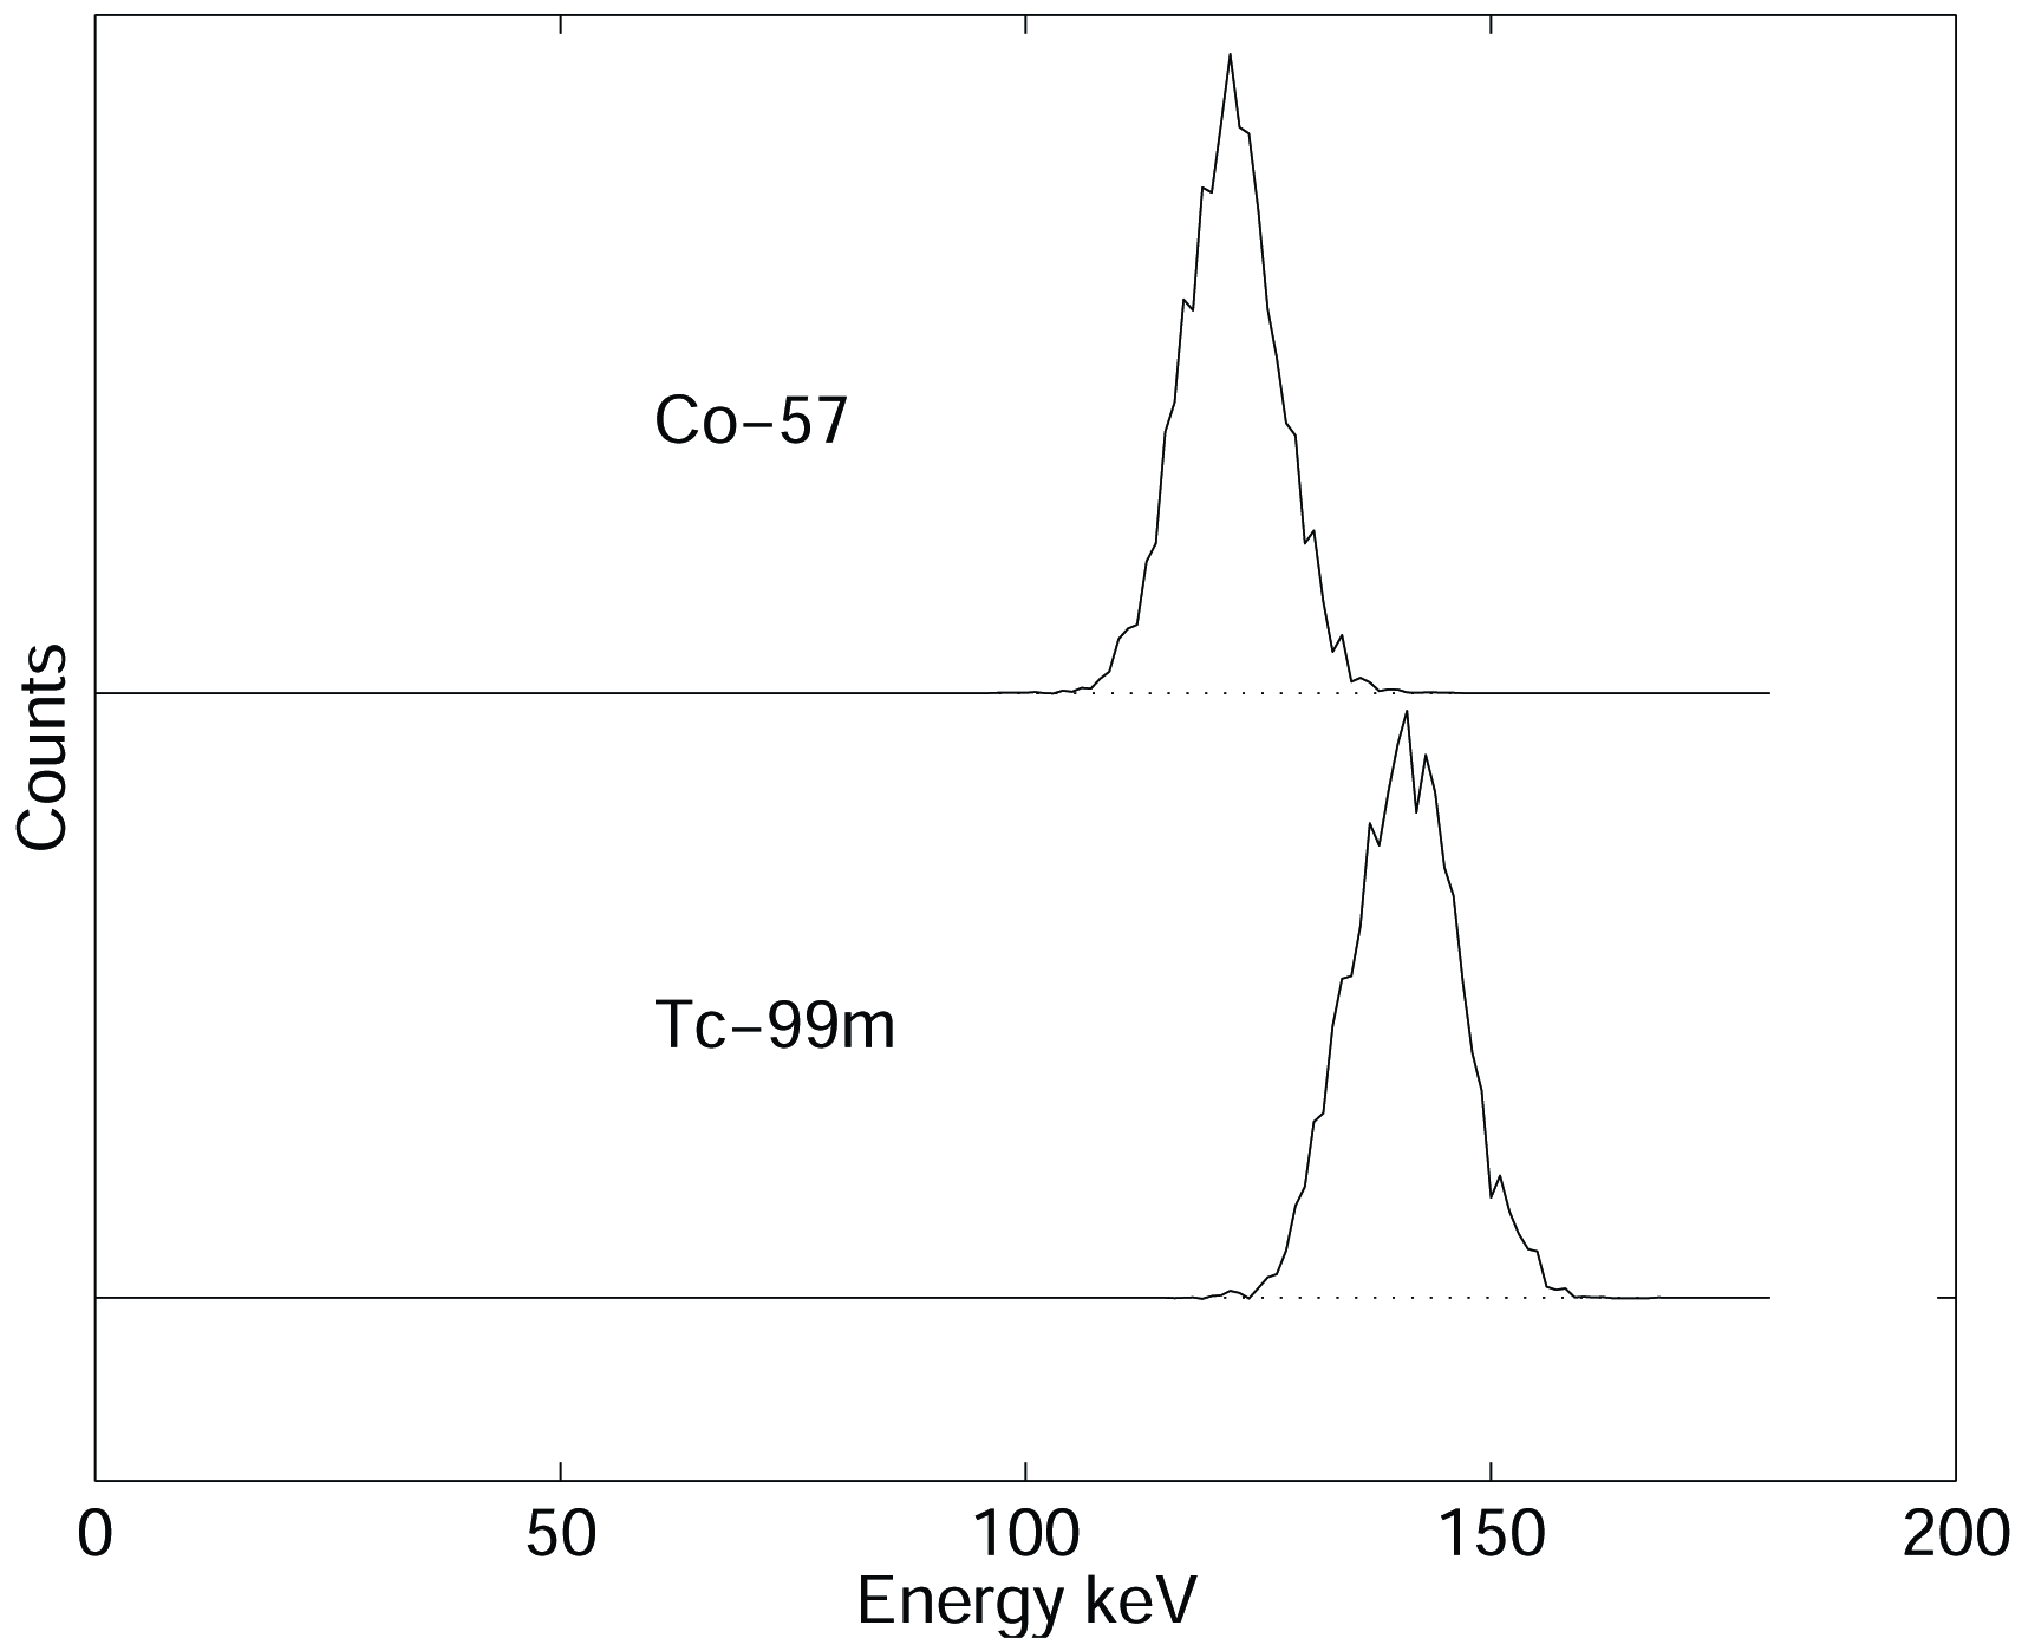
Figure 5:(Simulated) energy spectra of Cobalt (57Co, 122 keV) and technetium (99mTc, 140 keV).
Linearity
The linearity is measured with a line source phantom as shown in Figure 6. This can be obtained in several ways. One is to use a lead sheet with long slids of 1 mm width, positioned at regular distances (e.g. 3 cm distance between the slids). Remove the collimator (to avoid interference between the slids and the collimator septa, possibly resulting in beautiful but useless Moire patterns), put the lead sheet on the camera (very carefully, the fragile crystal is easily damaged and very expensive!) and irradiate with a uniform phantom or point source at large distance.
NEMA states that integral linearity is defined as the maximum distance between the measured line and the true line. The true line is obtained by fitting the known true lines configuration to the image.
The NEMA definition for the differential linearity may seem a bit strange. The procedure prescribes to compute several image profiles perpendicular to the lines. From each profile, the distances between consecutive lines is measured, and the standard deviation on these distances is computed. The maximum standard deviation is the differential linearity. This procedure is simple, but not 100% reproducible.
With current computers, it is not difficult to implement a better and more reproducible procedure. However, a good standard must not only produce a useful value, it must also be simple. If not, people may be reluctant to accept it, and if they do, they might make programming errors when implementing it. At the time the NEMA standards were defined, the procedure described above was a good compromise.
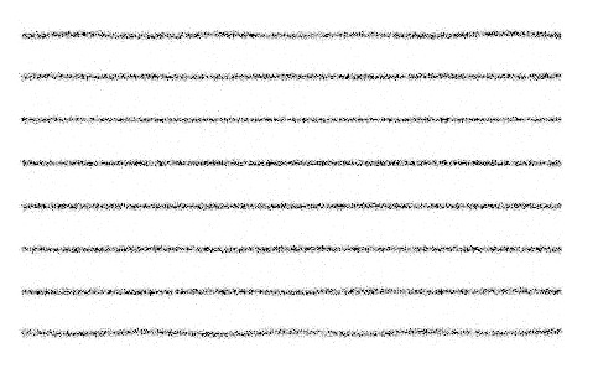
Figure 6:Image of a line phantom acquired on a gamma camera with poor linearity correction.
Dead time
The dead time measurements are based on some dead time model, for example equations (37) or (38). The effective dead time τ is the parameter we want to obtain. Usually, the exact amount of radioactivity is unknown as well, so there are two unknown variables. Consequently, we need at least two measurements to determine them. Many procedures can be devised. A straightforward one is to use a strong source with short half life, and acquire images while the activity decays. At low count rates the gamma camera is known to work well, so we assume that this part of the curve is correct (slope 1). Thus, we can compute what the camera should have measured, the true count rate, allowing us to draw the curve of Figure 24. Then, τ can be computed, e.g. by fitting the model to the rest of the curve.
A faster method suggested in HY Oei et al. (n.d.) is to prepare two sources with the same amount of radioactivity (difference less than 10%). Select the sources such that when combined the count rate is probably high enough to produce a noticeable dead time effect (otherwise the subsequent analysis will be very sensitive to noise). Put one source on the camera and measure the count rate . Put the second source on the camera and measure . Remove the first source and measure . This produces the following equations:
where the (unknown) true count rates are marked with an asterisk. If we did a good job preparing the sources, then we have , so we can simplify the equations into
where we define . A bit of work (left as an exercise to the reader) leads to
Knowing τ, we can predict the dead time for any count rate, except for very high ones (which should be avoided at all times anyway, because in such a situation limited information is obtained at the cost of increased radiation to the patient).
Sensitivity
Sensitivity is measured by recording the count rate for a known radioactive source. Because the measurement should not be affected by attenuation, NEMA prescribes to use a recipient with a large (10 cm) flat bottom, with a bit of water (3 mm high) to which about 10 MBq radioactive tracer has been added. The result depends mainly on the collimator, and will be worse if the resolution is better.
Whole body imaging
A camera which is not ready for planar imaging, is obviously not ready for whole body imaging either. In contrast, a camera that meets all quality control criteria for planar imaging could still fail for whole body imaging. There is only one essential difference between planar imaging and whole body imaging: in whole body imaging the patient is continuously moving with respect to the camera. In some systems the patient bed is translated, in other systems the camera is moved, but the potential problems are the same. During whole body imaging a single large planar image is acquired (see Figure 3), which is as wide as the crystal (let us call that the -axis) but much longer (the -axis). Consequently, the coordinates in the large image are computed as
where is the normal planar coordinate, is the table speed and is the time. The speed must be expressed in pixels per s, while the motor of the bed is trying to move the bed at a predefined speed in cm per s. Consequently, whole body image quality will only be optimal if
planar image quality is optimal, and
the -pixel size is exact, and
the motor is working at the correct speed.
Bed motion
The bed motion can be measured directly to check if the true scanning speed is identical to the specified one.
Uniformity
If the table motion is not constant, the image of a uniform source will not be uniform. Of course, this uniformity test will also be affected if something is wrong with planar performance. Uniformity is not affected if the motion is wrong but constant, except possibly at the beginning and the end, depending on implementation details.
Pixel size, resolution
If there is something wrong with the conversion of table position to pixel coordinate, this is very likely to affect the pixel size and spatial resolution in the direction of table motion . One can measure the pixel size directly by measuring two points with very different -coordinate. It is probably easier is to acquire a bar phantom or line phantom, which gives an immediate impression of the spatial resolution.
SPECT
A gamma camera which survives all quality control tests for planar imaging may still fail for SPECT, since SPECT poses additional requirements on the geometry of the system.
Center-of-rotation
In SPECT, the gamma camera is used to acquire a set of sinograms, one for each slice. Sinogram data are two-dimensional, one coordinate is the angle, the other one the distance between the origin and the projection line. Consequently, a sinogram can only be correctly interpreted if we know which column in the image represents the projection line at zero distance. By definition, this is the point where the origin, the rotation center is projected.
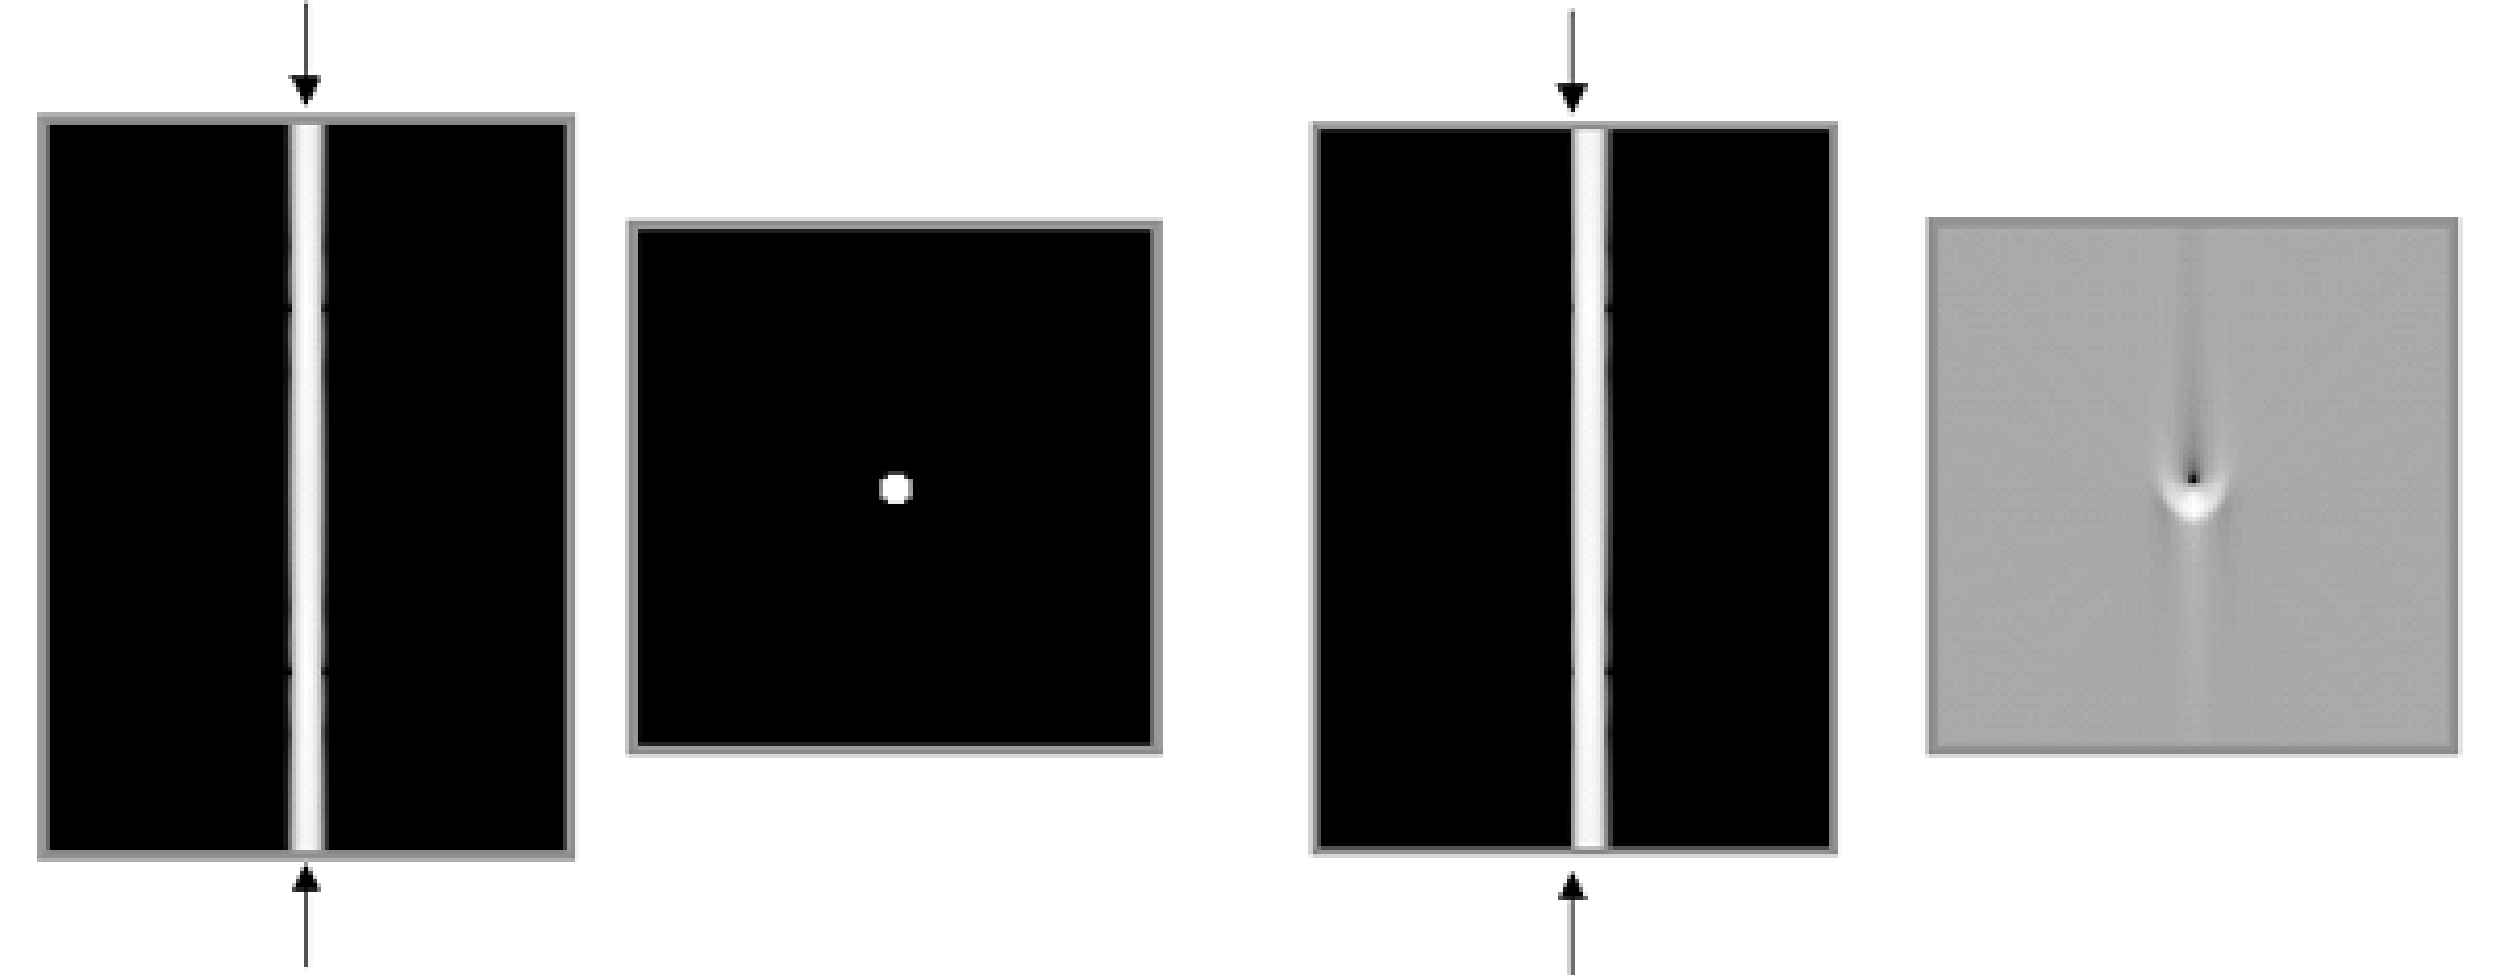
Figure 7:Simulation of center of rotation error. Left: sinogram and reconstruction in absence of center of rotation error. Right: filtered backprojection with center of rotation error equal to the diameter of the point.
For reasons of symmetry it is preferred (but not necessary) that the projection of the origin is the central column of the sinogram, and manufacturers attempt to obtain this. However, because of drift in the electronics, there can be a small offset. This is illustrated in Figure 7. The leftmost images represent the sinogram of a point source and the corresponding reconstruction if everything works well. The rightmost images show what happens if there is a small offset between the projection of the origin and the center of the sinogram (the position where the origin is assumed to be during reconstruction, indicated with the arrows in the sinogram). For a point source in the center, the sinogram becomes inconsistent: the point is always at the right, no matter the viewing angle. As a result, artifacts result in filtered backprojection (the backprojection lines do not intersect where they should), which become more severe with increasing center-of-rotation error.
From the sinogram, one can easily compute the offset. This is done by fitting a sine to the mass center in each row of the sinogram, determining the values of , φ and by minimizing
The mass center, computed for each row , represents the detector position of the point source for the projection acquired at angle , where is the angle between subsequent sinogram rows, and is the row index. The offset is the fitted value for , while and φ are nuisance variables to be determined because we don’t know exactly where the point source was positioned. Once the offset is known, we can correct for it, either by shifting the sinogram over , or by telling the reconstruction algorithm where the true rotation center is. SPECT systems software provides automated procedures which compute the projection of the rotation axis from a point source measurement. Older cameras suffered a lot from this problem, newer cameras seem to be far more stable.
Detector parallel to rotation axis
If the detector is not parallel to the rotation axis, the projections for different angles are not parallel. This gives rise to serious artifacts. Figure 8 shows that the projection of a point source seems to oscillate parallel to the rotation axis while the camera rotates (except for points on the rotation axis).
The figure tells the way to detect the error: put a point source in the field of view, acquire a SPECT study and check if the point moves up and down in the projections (or disappears from one sinogram to show up in the next one). For a fixed angle, the amplitude of the apparent motion is proportional to the distance between the point and the rotation axis. Nicely centered point sources will detect nothing.
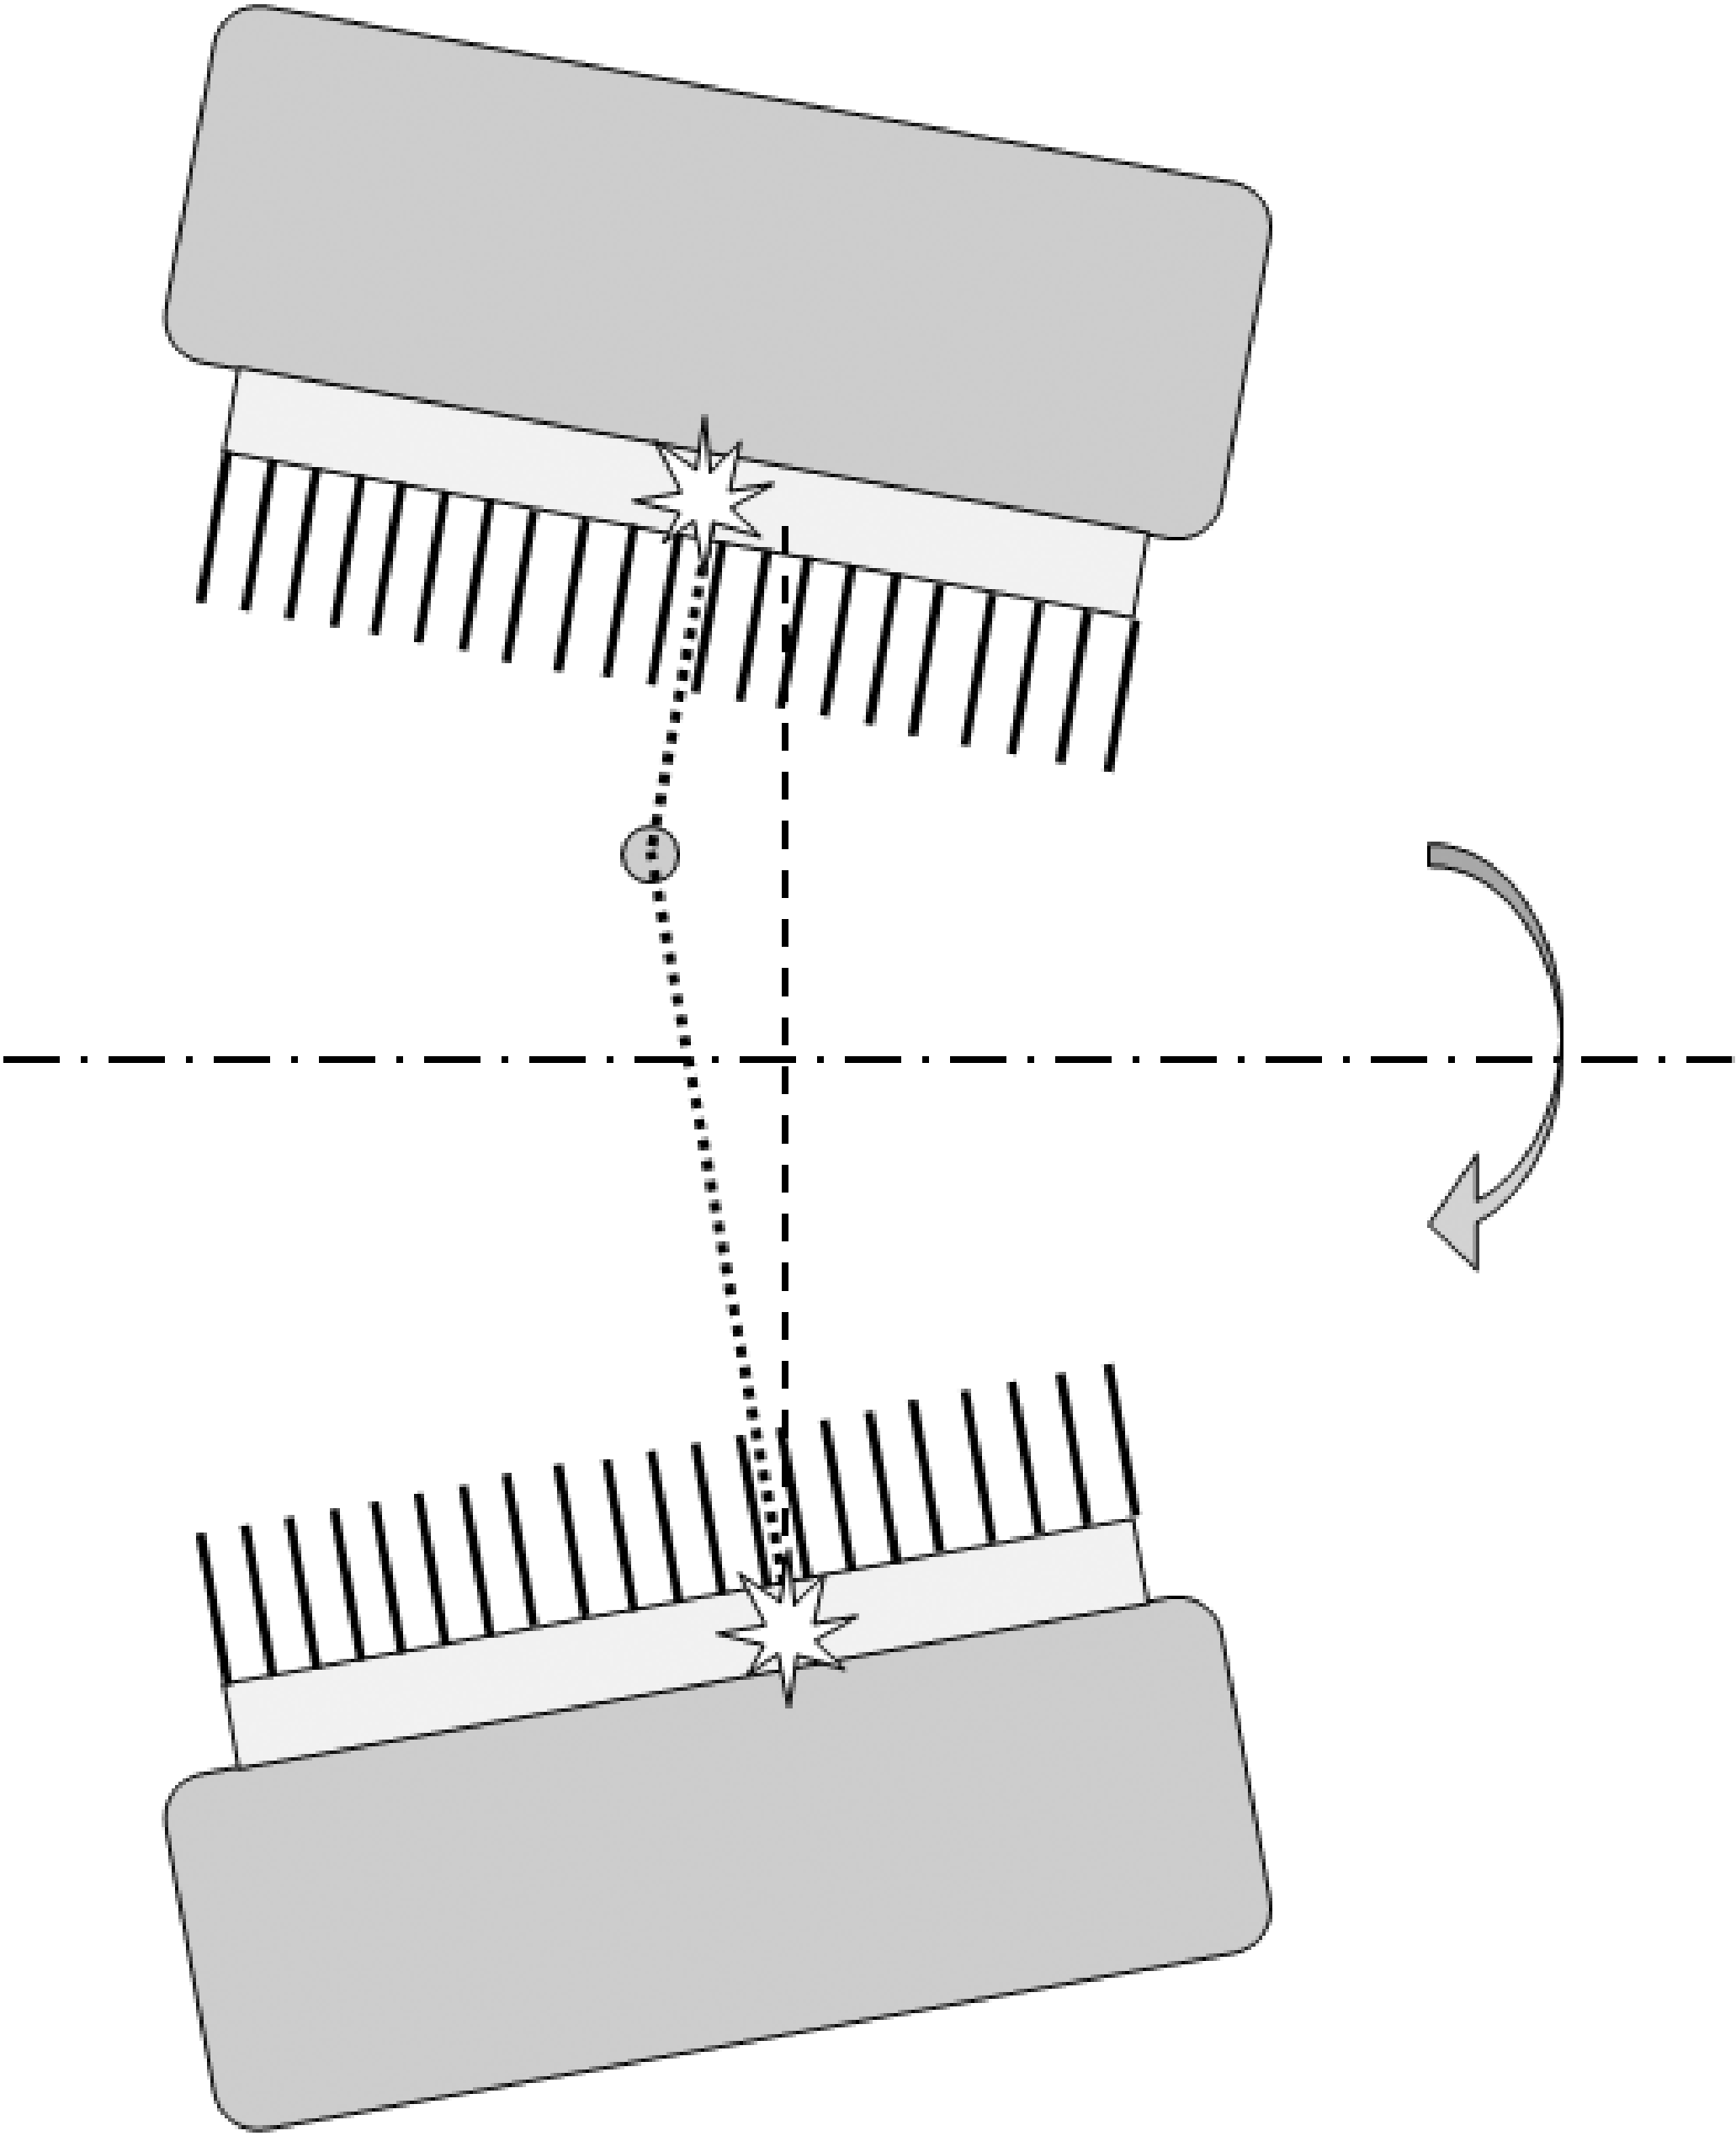
Figure 8:If the gamma camera is not parallel to the rotation axis, a point apparently moves up and down the axis during rotation.
SPECT phantom
It is a good idea to scan a complex phantom every now and then, and compare the reconstruction to images obtained when the camera was known to be tuned optimally. Several companies offer polymethylmetacrylate (= perspex, Plexiglas) phantoms for this purpose. The typical phantom is a hollow cylinder which must be filled with water containing a radioactive tracer (Figure 9). Various inserts are provided, e.g. sets of bars of different diameter, allowing to evaluate the spatial resolution. A portion of the cylinder is left free of inserts, allowing to check if a homogeneous volume is reconstructed into a homogeneous image. Almost any camera problem will lead to loss of resolution or loss of contrast.
When filling a phantom with “hot” water, do not count on diffusion of the tracer molecules to obtain a uniform distribution: it takes for ever before the phantom is truly uniform. The water must be stirred.
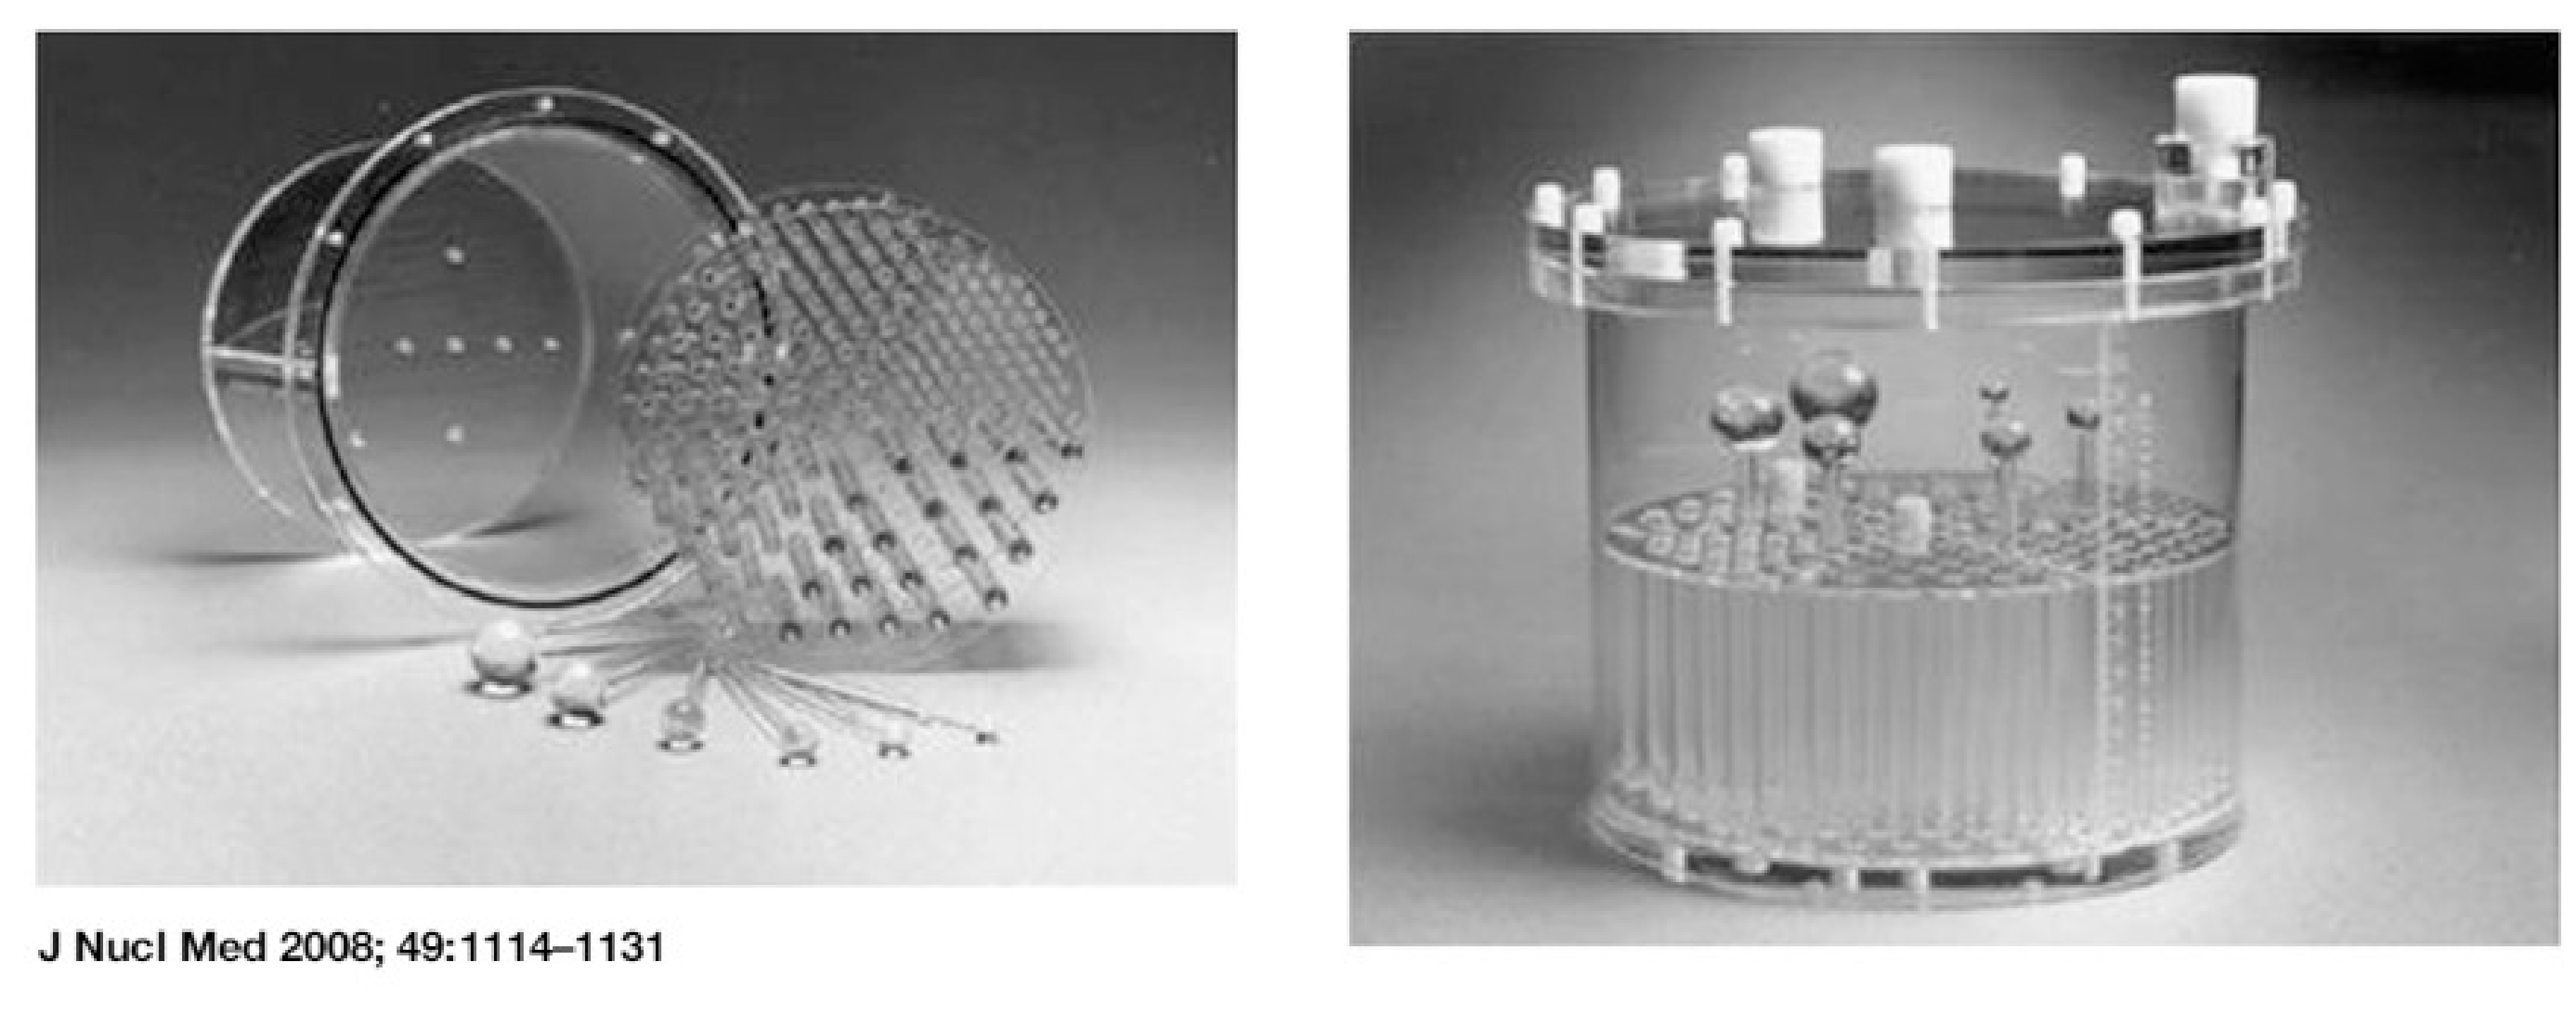
Figure 9:A typical “Jaszczak phantom”, named after a very well known SPECT researcher who developed many such phantoms (figure from P. Zanzonico, J Nucl Med 2008; 49:1114-1131).
Quantification
In principle, a SPECT system can produce quantitative images, just like a PET system, albeit with poorer resolution. This has long been ignored in clinical practice, because absolute quantification usually adds little diagnostic value. However, SPECT is increasingly being used to prepare or verify radionuclide therapy treatments. In radionuclide therapy, a large amount of a tumor-targetting radiopharmacon is administered to the patient. The radiopharmacon typically carries a beta- or alpha-emitter. In contrast to gamma photons, these particles deposit their energy at short distances, and when accumulated in the tumor lesions, they will deposit a large amount of energy in the tumors and much less in the surrounding healthy tissues. For those applications, it is important to determine the exact amount of radioactivity in the tumors and healthy tissues, to ensure that the tumors are destroyed and the damage to the healthy tissues is as low as possible.
If the gamma camera is in good shape, and if the SPECT images are reconstructed with attenuation correction and scatter correction, then the reconstructed image pixel values should be proportional to the local activity at that location. The constant of proportionality can be obtained from a phantom measurement. A cylinder is filled with water containing a well known uniform tracer concentration. The cylinder is scanned and an image is reconstructed with attenuation and scatter correction. Then the calibration factor is computed as the ratio of the true tracer concentration in Bq/ml to the reconstructed value. The reconstructed value is typically computed as the mean value in a volume centered inside the phantom (this volume should stay away from the phantom boundary, to avoid the influence of partial volume effects). Multiplication of the reconstructed images with this calibration factor converts them into quantitative images, with pixel values giving the local activity in Bq/ml.
The calibration factor is tracer dependent, because the sensitivity of the gamma camera to the radionuclide activity depends on the branching ratio, on the energy (or energies) of the emitted photons and on the collimator.
For “well-behaved” tracers which emit photons at a single energy that is not too high, such as 99mTc, the attenuation and scatter correction is accurate. As a result, the calibration can be accurate too. For tracers that emit photons at different energies, such as 111In, attenuation and scatter correction is more difficult. Scatter correction is more complicated because the Compton scattered photons from the high energy peak may end up in the low energy window. Attenuation correction is more complicated because the attenuation is energy dependent. For such tracers, accurate quantification is still possible, but it is more challenging.
The calibration factor must be verified, and corrected if necessary, a few times per year, to ensure that the SPECT system remains quantitatively accurate.
Positron emission tomograph
A PET-system is more expensive and more complicated than a gamma camera, because it contains more and faster electronics. However, in principle, it is easier to tune. The reason is that a multicrystal design has some robustness because of its modularity: if all modules work well, the whole system works well. A module contains only a few PMT’s and a few crystals, and keeping such a small system well-tuned is “easier” than doing the same for a large single crystal detector.
Evolution of blank scan
Older PET-systems have computer controlled transmission sources: the computer can bring them in the field of view, and can have them retracted into a shielding container. When the transmission rod sources are extended they are continuously rotated near the perimeter of the field of view, such that all projection lines will be intersected.
A new blank scan is automatically acquired in the early morning, before working hours. This blank scan is a useful tool for performance monitoring, since all possible detector pairs contribute to it. The daily blank scan is compared to the reference blank scan, and significant deviations are automatically detected and reported, so drift in the characteristics is soon detected. If a problem is found it must be remedied. Often it is sufficient to redo calibration and normalization (see below). Possibly a PMT or an electronic module is replaced, followed by calibration and normalization. When the system is back in optimal condition, a new reference blank scan is acquired.
With the introduction of PET/CT, PET-systems no longer have these built-in transmission sources. Therefore, the procedure has been adapted such that it works with smaller phantoms, e.g. a cylinder (typically with diameter of about 20 cm) filled with a solid solution containing 68Ge. All detectors still cotnribute to the scan of such a phantom, but there are now many detector pairs that will see no counts, because they don’t intersect the phantom. Therefore, the performance of these detector pairs must be deduced from the performance of the individual detectors.
Normalization
Normalization is used to correct for non-uniformities in PET detector sensitivities (see section PET camera). The manufacturers provide software to compute and apply the sensitivity correction based on a scan of a particular phantom (e.g. a radioactive cylinder positioned in the center of the field of view). Current PET/CT (or PET/MR) systems do not have a transmission scan. Instead of the blank scan, they use a scan of this phantom to detect, quantify and correct changes in detector performance over time.
Front end calibration
The term “calibration” refers here to a complex automated procedure which
tunes the PMT-gains to make their characteristics as similar as possible,
determines the energy and position correction matrices for each detector module,
determines differences in response time (a wire of 1 m adds 3 ns under optimal conditions) and uses that information to make the appropriate corrections, to ensure that the coincidence window (about 10 ns in non-TOF PET and around 500 ps in TOF-PET) meets its specifications.
The first two operations are performed with a calibrated phantom carefully positioned in the field of view, since 511 keV photons are needed to measure spectra and construct histograms as a function of position. The timing calibration is based on purely electronic procedures, without the phantom (since one cannot predict when the photons will arrive).
Quantification
When a PET system is well tuned, the reconstructed intensity values are proportional to the activity that was in the field of view during the PET scan. This constant of proportionality (called calibration factor or PET scale factor or so) is determined from a phantom measurement. A cylinder is filled with a well known and uniform tracer concentration, and a PET scan is acquired. The calibration factor is computed as the ratio of the reconstructed value to the true tracer concentration in Bq/ml. The reconstructed value is typically computed as the mean value in a volume centered inside the phantom (this volume should stay away from the phantom boundary, to avoid the influence of partial volume effects). Once the system knows this ratio, its reconstruction program(s) produce quantitative images of the measured tracer concentration in Bq/ml. The calibration factor must be verified, and corrected if necessary, a few times per year, to ensure that the PET system remains quantitatively accurate.
- HY Oei, JAK Blokland, & Nederlandse Vereniging voor Nucleaire Geneeskunde. (n.d.). Aanbevelingen Nucleaire Geneeskundige Diagnostiek. Eburon.
- JAJ Camps, MJPG van Kroonenburgh, P van Urk, & KS Wiarda. (n.d.). Leerboek Nucleaire Geneeskunde. Elsevier.