In nuclear medicine, photon detection hardware differs considerably from that used in CT. In CT, large numbers of photons must be acquired in a very short measurement. In emission tomography, a very small number of photons is acquired over a long time period. Consequently, emission tomography systems are optimized for sensitivity.
Photo-electric absorption is the preferred interaction in the detector, since it results in absorption of all the energy of the incoming photon. Therefore the detector material must have a high atomic number (the atomic number Z is the number of electrons in the atom). Since interaction probability decreases with increasing energy, a higher Z is needed for higher energies.
In single photon imaging, 99mTc is the tracer that is mostly used. It has an energy of 140 keV and the gamma camera performance is often optimized for this energy. Obviously, PET-cameras have to be optimized for 511 keV.
Detecting the photon
Different detector types exist, but the current standard, both in SPECT and PET, is the scintillation detector. The following sections describe the scintillation crystal, the photomultiplier tube and how crystal and tubes can be combined to make a two-dimensional gamma detector. After that, some alternative designs and new developments will be mentioned.
Scintillation crystal
A scintillation crystal is a remarkable material that stops the incoming photon and in doing so produces a flash of visible light, a scintillation. So the problem of detecting the incoming photon is now transformed in the easier problem of detecting the light flash.
The scintillation stops the photon via photo-electric absorption or via multiple scattering events. The resulting photo-electron travels through the crystal, distributing its kinetic energy over a few thousands other electrons in multiple collisions. As a result, there will be a few thousands of a electrons in an excited state. After a short time, these electrons will release their energy in the form of a photon of a few eV. These secondary photons are visible to the human eye (they are usually blue): this is the scintillation.
The exact wavelength (or color) of the light flash depends on the crystal, but not on the energy of the incoming high-energy photon. If a photon with a higher energy enters the crystal, it will send more electrons to an higher energy level. Each of these electrons will then produce a single scintillation-photon, always with the same color. So if we want to have an idea about the energy of the incoming photon, we need to look at the number of scintillation photons (the intensity of the flash), and not at their energy (the color of the flash).
Many scintillators exist, and quite some research on new scintillators is still going on. The crystals that are mostly used today are NaI(Tl) for single photons (140 keV) in gamma camera and SPECT, and LSO (lutetium oxyorthosilicate) for annihilation photon (511 keV) in PET. Before LSO was found, BGO (bismuth germanate) was used for PET, and there are still some old BGO-based PET systems around. Some other crystals, such as GSO (gadolinium oxyorthosilicate) and LYSO (LSO with a bit of Yttrium, very similar to LSO) are used for PET as well. The important characteristics of the crystals are:
Transparency. If it is not transparent, we cannot see or detect the light flash.
Photon yield per incoming keV. More photons per keV is better, since the light flash will be easier to see. The scintillation and its detection are statistical processes, and the uncertainty associated with it will go down if the number of scintillation photons increases.
Scintillation time. This is the average time that the electrons remain in the excited state before releasing the scintillation photon. Shorter is better, since we want to be ready for the next photon.
Attenuation coefficient for the high energy photon. We want to stop the photon, so a higher attenuation coefficient is better. Denser materials tend to stop better.
Wave length of the scintillation light. Some wave lengths are easier to detect than others.
Ease of use: some crystals are very hygroscopic: a bit of water destroys them. Others can only be produced at extremely high temperatures. And so on.
Table 1:Characteristics of a few scintillation crystals.
NaI(Tl) | BGO | LSO | GSO | |
Photons per keV | 40 | 5 … 8 | 20 … 30 | 12 |
Scintillation decay time [ns] | 230 | 300 | 40 | 65 |
linear atten. coeff. [1/cm] (at 511 keV) | 0.34 | 0.95 | 0.87 | 0.67 |
Wave length [nm] | 410 | 480 | 420 | 440 |
Melting point (oC) | 651 | 1050 | 2050 | 1950 |
The scintillation photons are emitted to carry away the energy set free when an electron returns to a lower energy level. Consequently, these photons contain just the right amount of energy to drive an electron from a lower level to the higher one. In pure NaI this happens all the time, so the photons are reabsorbed and the scintillation light never leaves the crystal. To avoid this, the NaI crystal is doped with a bit of Tl (Thallium). This disturbs the lattice and creates additional energy levels. Electrons returning to the ground state via these levels emit photons that are not reabsorbed. NaI is hygroscopic (similar as NaCl (salt)), so it must be protected against water. LSO has excellent characteristic, but is difficult to process (formed at very high temperature), and it is slightly radioactive. Table 1 lists some characteristics of three scintillation crystals.
Photo Multiplier Tube
The scintillation crystal transforms the incoming photon into a light flash. That flash must be detected. In particular, we want to know where it occurred, when it occurred and how intense it was (to compute the energy of the incoming photon). All this is usually obtained with photomultiplier tubes (PMT).
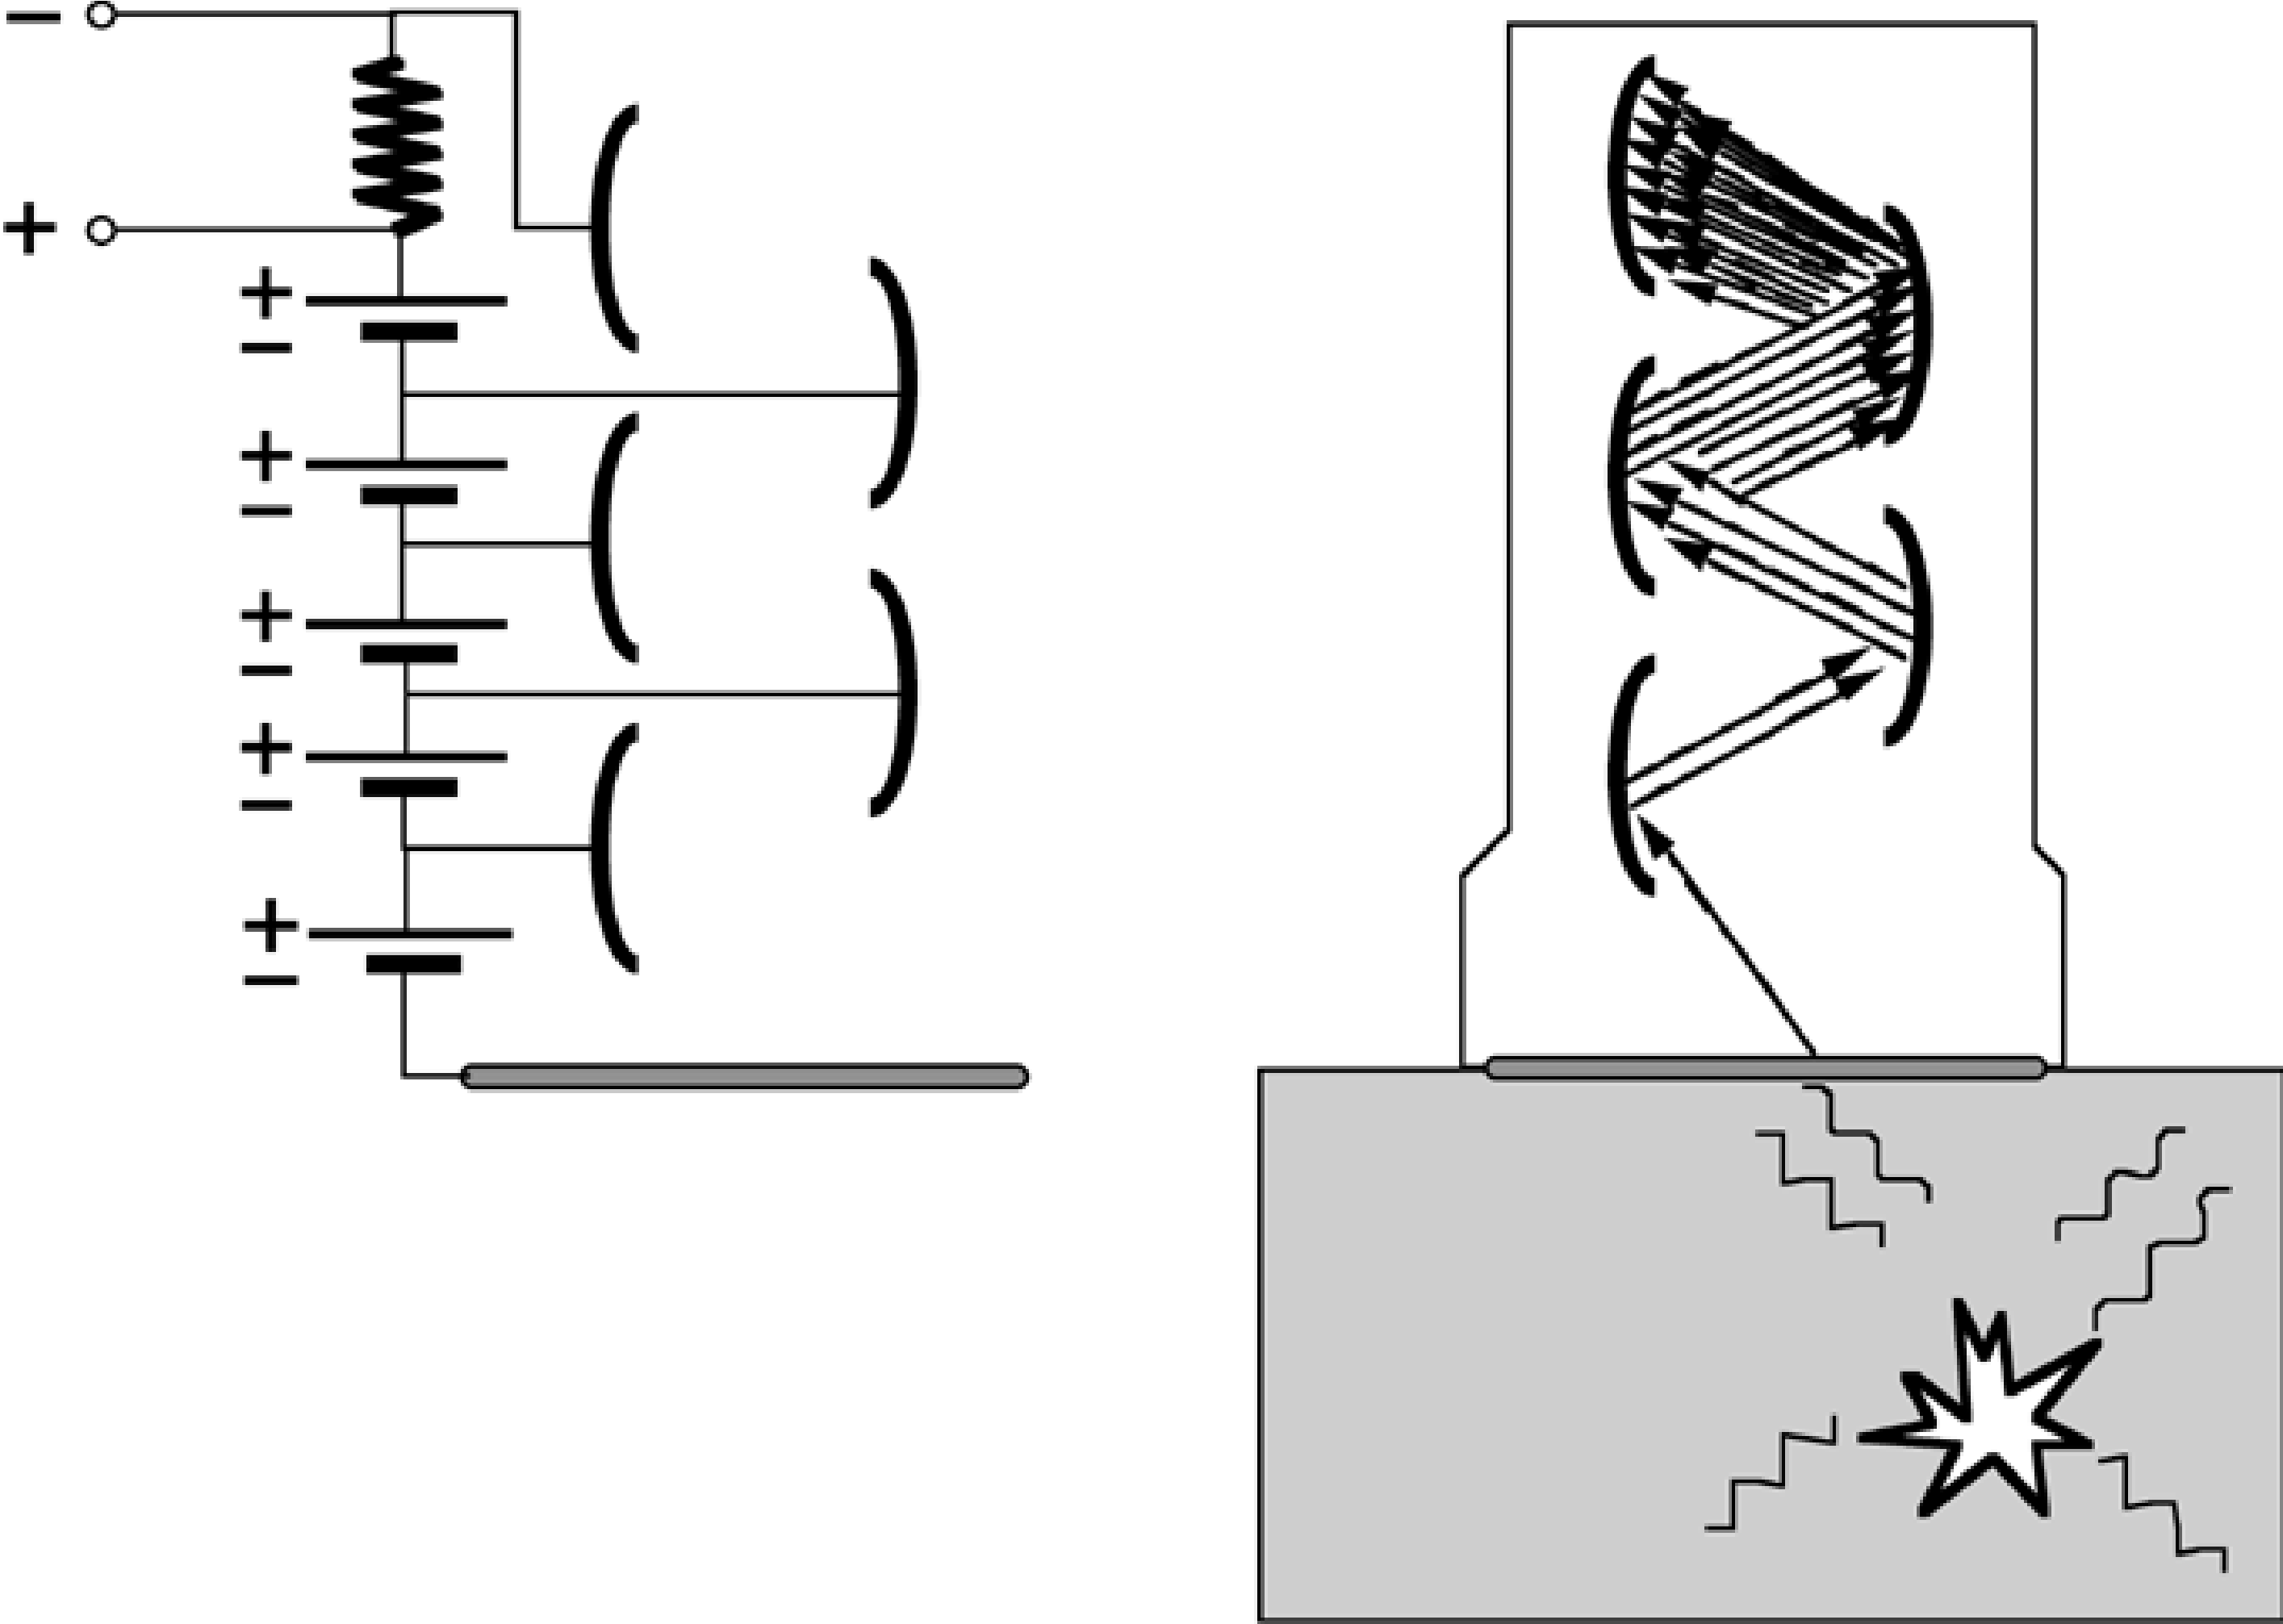
Figure 1:Photomultiplier. Left: the electrical scheme. Right: scintillation photons from the crystal initiate an electric current to the dynode, which is amplified in subsequent stages.
The PMT’s are glued onto the crystal, in order to detect the incoming scintillation photons. The PMT consists of multiple dynodes, the first of which (the photocathode) is in optical contact with the crystal. High negative voltage (in the order of 100 V) between the dynodes makes the electrons want to jump from one to the other, but they do not have enough energy to cross the gap in between (Figure 1). This energy is provided by the scintillation photon. The electron acquiring the threshold energy will be accelerated by the electrical field, and activate multiple electrons in the next dynode. After a few steps, a measurable voltage is created which is digitized with an analog-to-digital converter. There are usually about 10 to 12 dynodes, and each step amplifies the signal with a factor 3 … 6, so amplification can be in the order of one million.
The response time of a PMT is very short (a few ns) compared to the scintillation decay time.
Two-dimensional gamma detector
There are two ways to build a two-dimensional gamma detector based on scintillation. One way is to use a single very large crystal and connect multiple PMT’s to it. The other way is to combine small crystals in a large matrix.
Single crystal detector
This is the standard design for single photon detectors with NaI(Tl). One side of a single large crystal (e.g. 50 cm x 40 cm, 1 cm thick) is covered completely with PMT’s (… 50 … PMTs). The other side is covered with a layer acting as a mirror for the scintillation photons, so that as many as possible are collected in the PMT’s.
In principle, all PMT’s contribute to the detection of a single scintillation event. As mentioned before, the position, the time and the energy ( amount of scintillation photons) must be computed from the PMT-outputs.
Position:
The x-position is computed as
where is the PMT-index, the -position of the PMT and the integral of the PMT output over the scintillation duration. The -position is computed similarly. (1) is not very accurate and needs correction for systematic errors (linearity correction). The reason is that the response of the PMT’s does not vary nicely with the distance to the pulse. In addition, each PMT behaves a bit differently. This will be discussed later in this chapter.
Energy:
The energy is computed as
where is a coefficient converting voltage (integrated PMT output) to energy. The “constant” is not really a constant: it varies slightly with the energy of the high energy photon. Moreover, it depends also on the position of the scintillation, because of the complex and individual behavior of the PMT’s. Compensation of all these effects is called “energy correction”, and will be discussed below.
Time:
In positron emission tomography, we must detect pairs of photons which have been produced simultaneously during positron-electron annihilation. Consequently, the time of the scintillation must be computed as accurately as possible, so that we can separate truly simultaneous events from events that happen to occur almost simultaneously.
The scintillation has a finite duration, depending on the scintillator (see Table 1). The scintillation duration is characterized by the the decay time τ, assuming that the number of scintillation photons decreases as . The decay times of the different scintillation crystals are in the range of 40 to several 100 ns. This seems short, but since a photon travels about 1 meter in only 3.3 ns, we want the time resolution to be in the order of a few ns (e.g. to suppress the random coincidence rate in PET, as will be explained in section Mechanical collimation: inter-plane septa). To assign such a precise time to a relatively slow event, the electronics typically computes the time at which a predefined fraction of the scintillation light has been collected (constant fraction discriminator). In current time-of-flight PET systems based on LSO, one obtains a timing resolution of about 400 ps.
Multi-crystal detector matrix
Instead of using a single large crystal, a large detector area can be obtained by combining many small crystals in a two-dimensional matrix. The crystals should be optically separated (such that scintillation photons are mirrored at the edges), to make sure that the scintillation light produced in one crystal stays in that crystal. In the extreme case, each crystal has its own photomultiplier. Computation of position is “trivial” (although complicated in practice): it is the coordinate of the crystal in the matrix (no attempt is made to obtain sub-crystal accuracy). Energy is proportional to the total output of the PMT coupled to the crystal. In such a design, the top of the crystal is usually a square of 3 to 5 mm, and the crystal is a cm (140 keV) or a few cm (511 keV) thick. Consequently, the spatial resolution is about 4 mm, as in the single crystal case (see section Resolution).
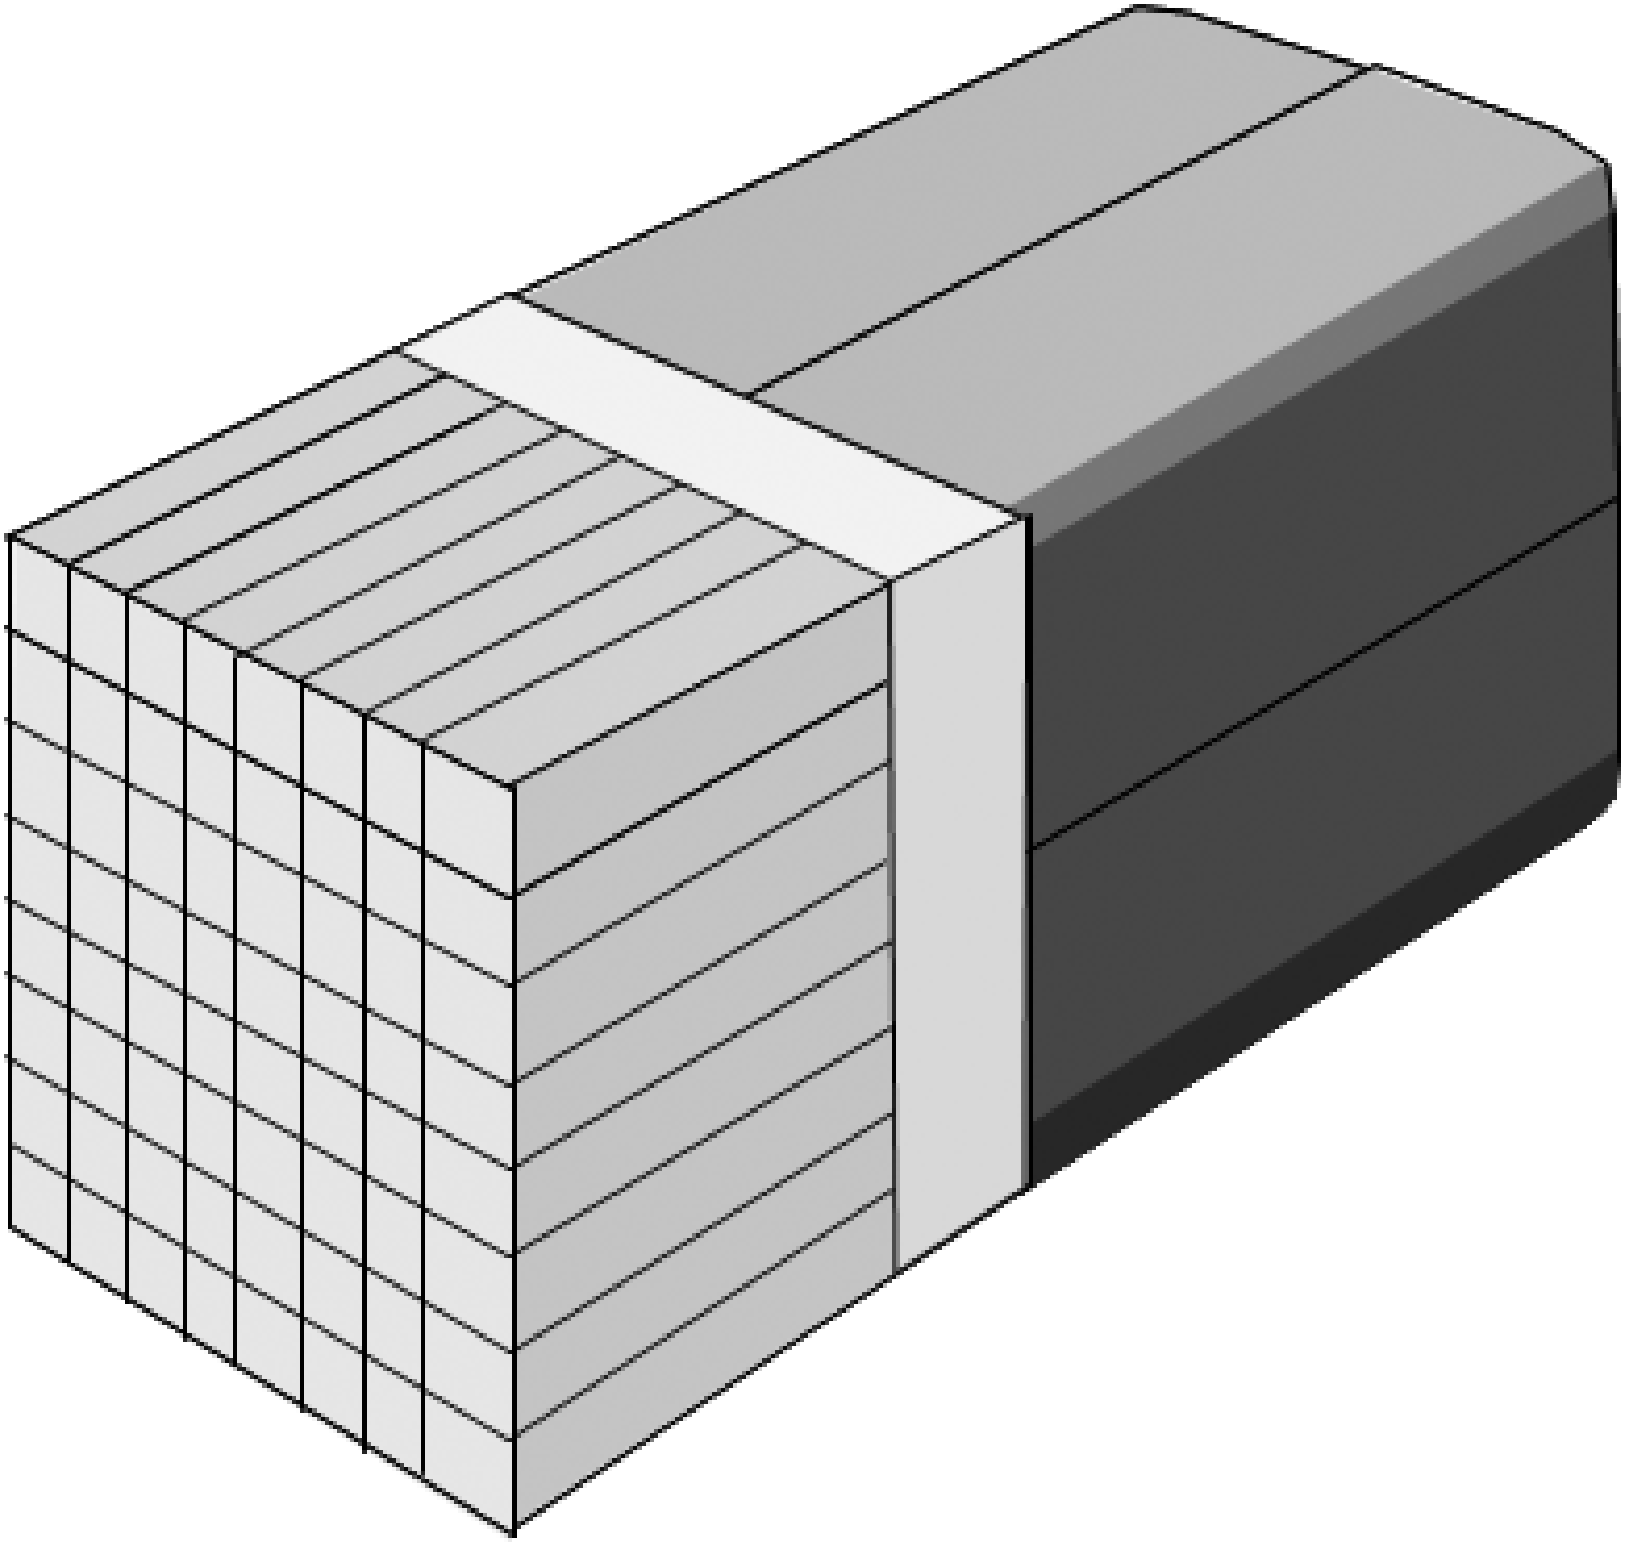
Figure 2:Multi-crystal module. The outputs of four photomultipliers are used to compute in which of the 64 crystals the scintillation occurred.
Photomultipliers are expensive, so the manufacturing cost can be reduced by a more efficient use of the PMT’s. Figure 2 shows a typical design, where a matrix of 64 (or more) crystals is connected to only four multipliers. The transparent block between the crystals and the PMT is called the light guide. It guides the light towards the PMT’s in such a way that the PMT amplitude changes monotonically with distance to the scintillating crystal. Thus, the relative amplitudes of the four PMT-outputs allow to compute in which crystal the scintillation occurred. For PET, the crystals have typically a cross section of about 4mm × 4 mm, and they are about 2 cm long.
In a single crystal design, all PMT’s contribute to the detection of a single scintillation. If two photons happen to hit the crystal simultaneously, both scintillations will be combined in the calculations and the resulting energy and position will be wrong! Thus, the maximum count rate is limited by the decay time of the scintillation event. In a multi-crystal design, many modules can work in parallel, so count rates can be much higher than in the single crystal design. Count rates tend to be much higher in PET than in SPECT or planar single photon imaging (see below). That is why most PET-cameras are using the multicrystal design, and gamma cameras are mostly single crystal detectors. However, single crystal PET systems and multi-crystal gamma cameras exist as well.
Resolution
The coordinates can only be measured with limited precision. They depend on the actual depth where the incoming photon was stopped, on the number of electrons that was excited, on the time the electrons remain in the excited state, on the direction in which each scintillation photon is emitted when the electron returns to a lower energy state and on the amount of electrons that is activated in the PMT’s in each dynode. These are all random processes: if two identical high energy photons enter the crystal at exactly the same position, all the forthcoming events will be different. We can only describe them with probabilities.
So if the photon really enters the crystal at , the actual measurement will produce a random realization drawn from a four-dimensional probability distribution . We can measure that probability distribution by doing repeated measurements in a well-controlled experimental situation. E.g., we can put a strongly collimated radioactive source in front of the crystal, which sends photons with the same known energy into the crystal at the same known position. This experiment would provide us the distribution for , and . The time resolution can be determined in several ways, e.g. by activating the PMT’s with light emitting diodes. The resolution on and is often called the intrinsic resolution.
If we plot all the measurements in a histogram, we will see the distribution. Usually the distribution is approximately Gaussian, and can be characterized by its standard deviation σ. Often one specifies the full width at half maximum (FWHM) instead (Figure 3). It is easy to show that for a Gaussian, the FWHM . This leads to a useful rule of thumb: any detail smaller than the FWHM is lost during the measurement.
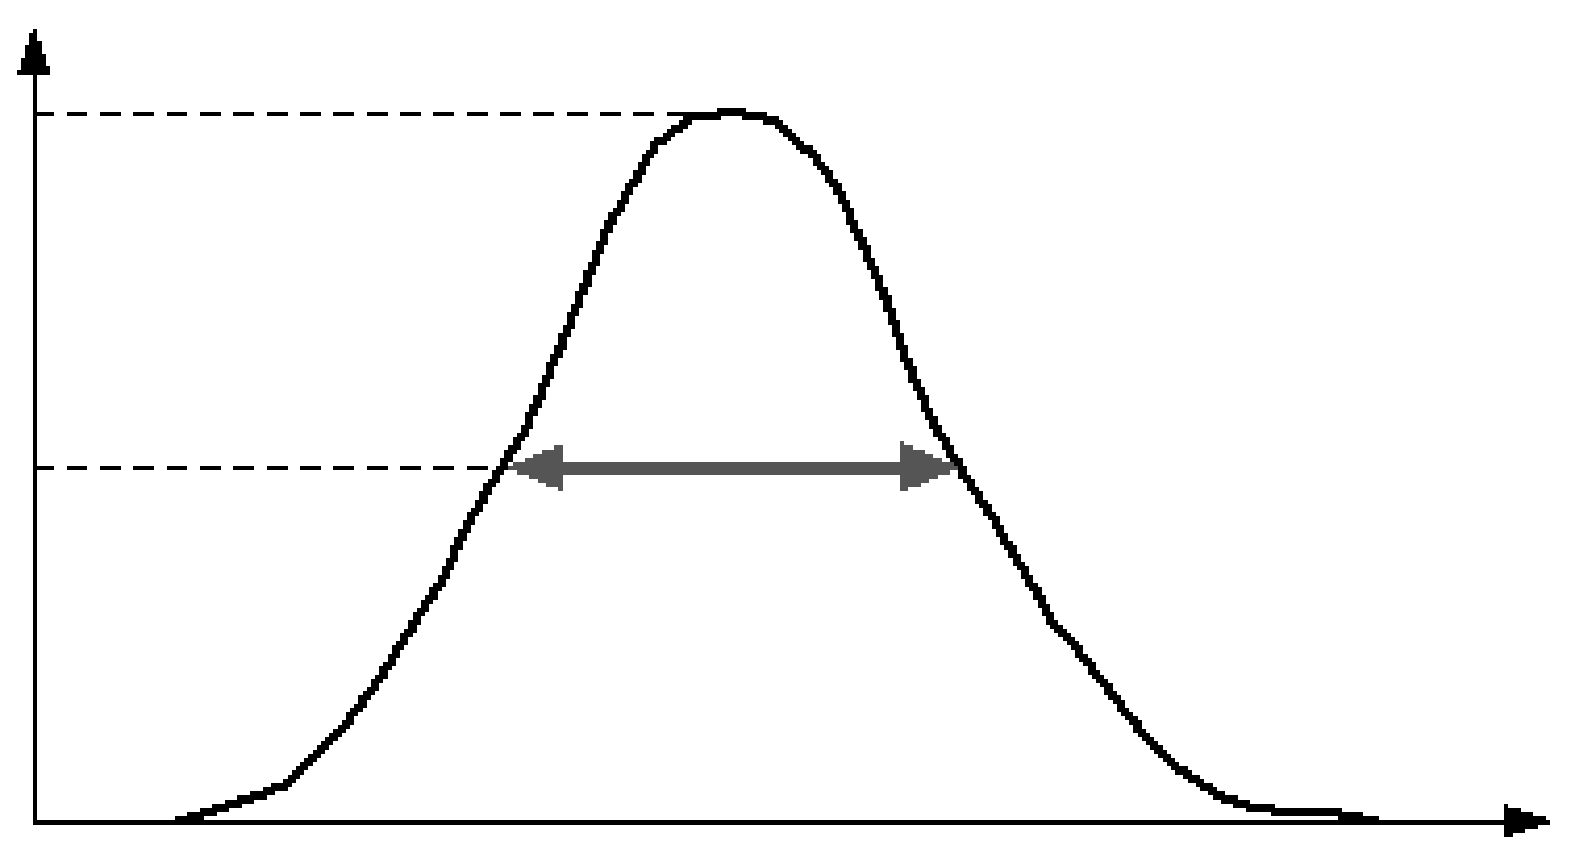
Figure 3:The full width at half max of a probability distribution
Position resolution of a scintillation detector has a FWHM of 3 to 4 mm. Energy resolution is about 10% FWHM at 140 keV in NaI(Tl) cameras, about 12% FWHM at 511 keV in BGO PET-systems, and about 10% FWHM in LSO and LYSO PET-systems.
Storing the data
To store the data, the information must be digitized. We do not want to lose information, so the round-off errors made during digitization should be small compared to the resolution. Thus, we obtain four digital numbers , which are the coordinates of a single detected photon. If all information must be preserved, we can directly store the four numbers in a list (list-mode acquisition). Obviously, this list may become very long. Often, we do not need all this information. The energy is usually simply used to decide whether we will accept or discard the photon, it does not need to be stored (this will be explained in section Compton scatter correction). Similarly, we often want to make a single image representing the situation in a certain time interval, so we only need a single two-dimensional image. To store this information efficiently, we prepare a zero two-dimensional matrix, an “empty” image, and increment the value at coordinates for the -th accepted photon. The number can be interpreted as a brightness, so we can display the result as an image on the screen. Brightness (or some pseudo-color) corresponds to tracer concentration.
Alternative designs
Although most current gamma cameras and PET systems are based on scintillation crystals combined with photomultipliers, there are many other detection systems. Some of these have very good characteristics, but their acceptance is hampered by the high cost price and, in some cases, by the fact that new algorithms must be developed before their full potential can be exploited. In the following, we only mention two promising technologies. Avalanche photodiodes can replace the PMT, CdZnTe detectors can replace the entire standard detection system.
Avalanche photodiodes
A semiconductor is a material in which the large majority of electrons are strongly bound to the atoms, but not all of them. Some electrons have enough energy to move freely about as in a metal. As a result, some of the atoms have lost an electron and have a net positive charge. This phenomenon gives rise to two types of charge carriers that can support electric current: electrons and holes. The former are the freely moving electrons. The latter are the positive vacancies left behind by the electrons. The holes can move, because an electron from a neighboring atom can jump over to fill in the vacancy, creating a similar vacancy in the neighboring atom.
Electric current is possible if freely moving electrons or holes are available. However, if for some reason none of them are available, the material acts as an insulator.
A diode is a simple electronic device with wonderful behavior. It has excellent conductivity in one direction, and extremely poor conductivity in the other. This remarkable feature is obtained by connecting two very different types of semiconductor materials, resulting in a very asymmetrical distribution of charge carriers. When forward voltage is applied, charge carriers are injected in great numbers, leading to very low resistance. When reverse voltage is applied, the electrons and holes are pulled away from the junction, so there is nothing left to support an electric current. Consequently, it behaves as an insulator in this mode.
In an avalanche photodiode (APD), a very high reverse voltage is applied, pulling away all charge carriers. However, a photon hitting the diode may supply enough energy to break the covalent bond of an electron, thus creating an electron-hole pair. This free electron will move rapidly in the electric field, releasing other electrons from their bond. Consequently, the photon creates an avalanche of free electrons, resulting in a measurable current. The current is proportional to the number of electrons in the avalanche, which in turn is proportional to the number of scintillation photons.
APD’s can be used to replace the photomultiplier. The advantage is that they are much smaller, but currently they are still more expensive than the PMTs. Another advantage is that they can be used in a strong magnetic field, while PMTs cannot. In hybrid PET/MRI systems, where the PET is operated inside the MRI-system, APDs or other similar devices must be used instead of PMTs.
A limitation of the APD is the long response time. Their timing resolution is not good enough for time-of-flight PET.
Multi-pixel photon counters (MPPC or SiPM)
A MPPC or Silicon Photomultiplier (SiPM) consists of an array of APDs which are operated in Geiger mode. This Geiger mode is obtained by using a relatively high voltage, such that an incoming photon will always create a maximum avalanche of electrons, independent of its energy. Thus, each Geiger mode APD can count the number of scintillation photons it is hit by. Because a single SiPM consists of many small APDs, the likelihood of multiple photons hitting the same APD simultaneously is small. Consequently, the SiPM reliably counts the number of scintillation photons hitting it.
Compared to the regular APD, the SiPM has the advantage of being much faster, achieving a response time similar to that of analogue photomultiplier tubes. That makes them fast enough for time-of-flight PET. Current timing resolution is around 400 ps, and prototypes with still better timing are currently being developed.
Solid state detectors
An effect similar to the one described above can be used to directly detect the high energy photon instead of the scintillation photons. For this purpose, a material with high stopping power is required. This is the operating principle of the CdZnTe detector: a strong electric field drives charge carriers created by the high energy photon towards a grid of collectors. Position resolution is now determined by the size of the collectors. Designs with sub-millimeter resolution exist. Energy resolution is excellent (3 %, as opposed to the 10 % in NaI(Tl)). The stopping power is similar to that of NaI(Tl). Currently, the main disadvantage of CdZnTe detectors is their very high cost.
As will be discussed in the next section, the resolution of a camera is dominated by the collimator acceptance angle. Consequently, the excellent spatial resolution of the CdZnTe detector is completely wasted in the traditional design. Some researchers are studying alternative camera designs and accompanying algorithms to fully exploit the excellent performance of this type of detectors.
Collimation
At this point, we know how the position and the energy of a photon impinging on the detector can be determined. Now we need a way to ensure that the impinging photons will produce an image. In photography, a lens is used for that purpose. But there are no easy-to-use lenses to focus the high energy photons used in nuclear medicine. So we must fall back on a more primitive approach: collimation. Collimation is the method used to make the detector “see” along straight lines. Different tomographic systems use different collimation strategies, as shown in Figure 4.
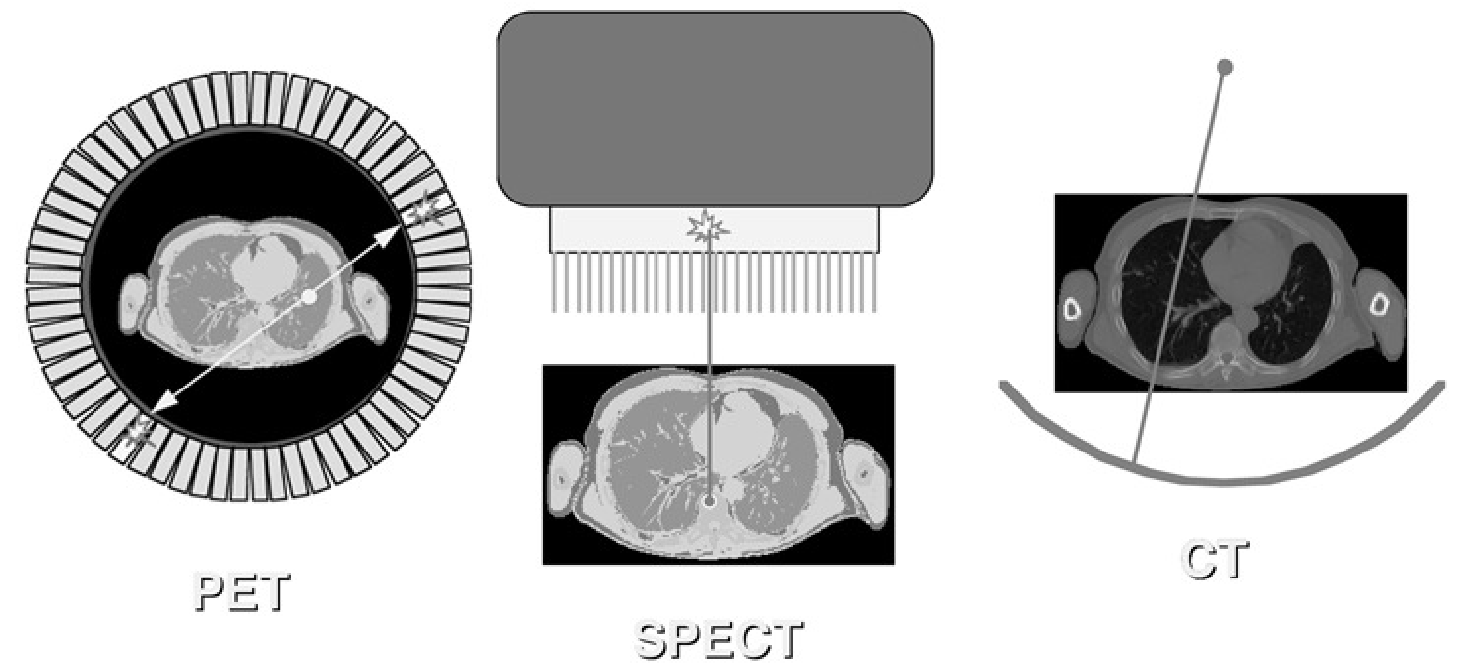
Figure 4:Collimation in the PET camera, the gamma camera (SPECT) and the CT camera.
In the CT-camera, collimation is straightforward: there is only one transmission source, so any photon arriving in the detector has traveled along the straight line connecting source and detector. In the PET-camera, a similar collimation is obtained: if two photons are detected simultaneously, we can assume they have originated from the same annihilation, which must have occurred somewhere on the line connecting the two detectors. But for the gamma camera there is a problem: only one photon is detected, and there is no simple way to find out where it came from. To solve that problem, mechanical collimation is used. A mechanical collimator is essentially a thick sieve with long narrow holes separated by thin septa. The septa are made from a material with strong attenuation (usually lead), so photons hitting a septum will be eliminated, mostly by photo-electric interaction. Only photons traveling along lines parallel to the collimator holes will reach the detector. So instead of computing the trajectory of a detected photon, we eliminate all trajectories but one, so that we know the trajectory even before the photon was detected. Obviously, this approach reduces the sensitivity of the detector, since many photons will end up in the septa. This is why a PET-system acquires more photons per second than a gamma camera, for the same activity in the field of view.
Most often, the parallel hole collimator is used, but for particular applications other collimators are used as well. Figure 5 shows the parallel hole collimator (all lines parallel), the fan beam collimator (lines parallel in one plane, focused in the other), the cone beam collimator (all lines focused in a single point) and the pin hole collimator (single focus point, but in contrast with other collimators, the focus is placed before the object).

Figure 5:Parallel hole, fan beam, cone beam and pin hole collimators.
Collimation ensures that tomographic systems collect information about lines. In CT, detected photons provide information about the total attenuation along the line. In gamma cameras and PET cameras, the number of detected photons provides information about the total radioactivity along the line (but of course, this information is affected by the attenuation as well). Consequently, the acquired two-dimensional image can be regarded as a set of line integrals of a three dimensional distribution. Such images are usually called projections.
Mechanical collimation in the gamma camera
Figure 6 shows that the sensitivity obtained with a mechanical collimation is very poor compared to that obtained with a lens. The mechanical collimator has a dominating effect on the resolution and sensitivity of the gamma camera. That is why a more detailed analysis of the collimator point spread function is in order.
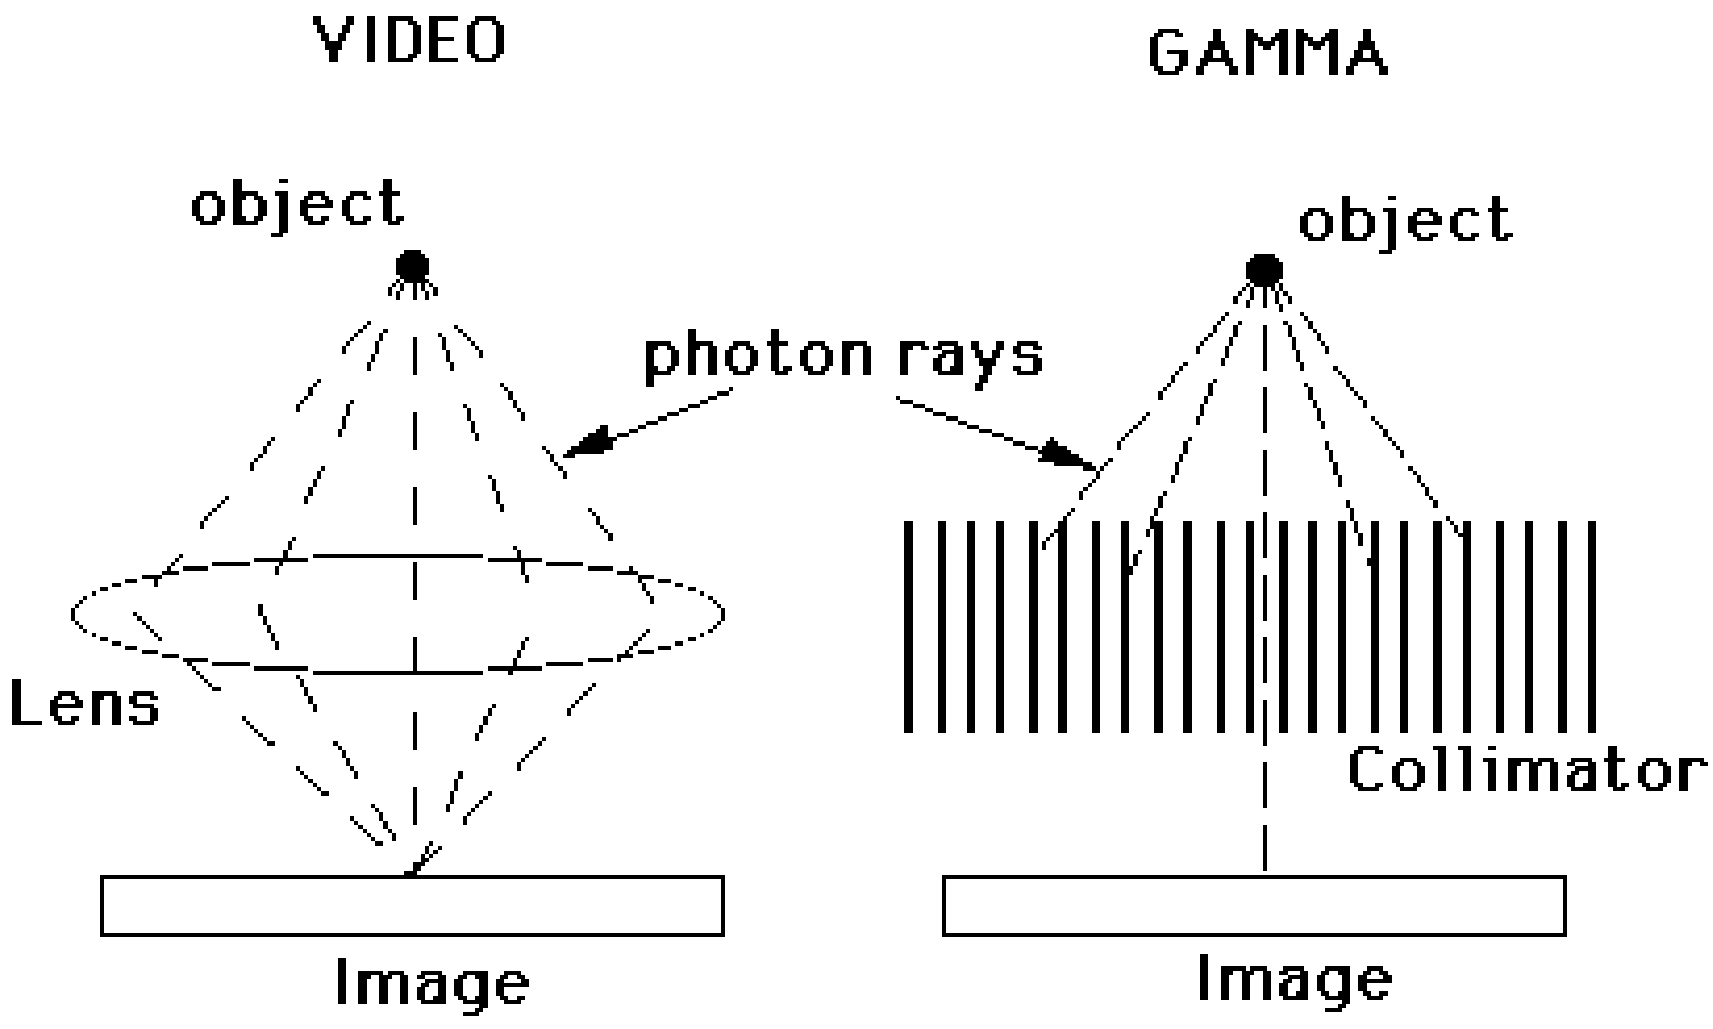
Figure 6:Focusing by a lens compared to ray selection by a parallel hole collimator
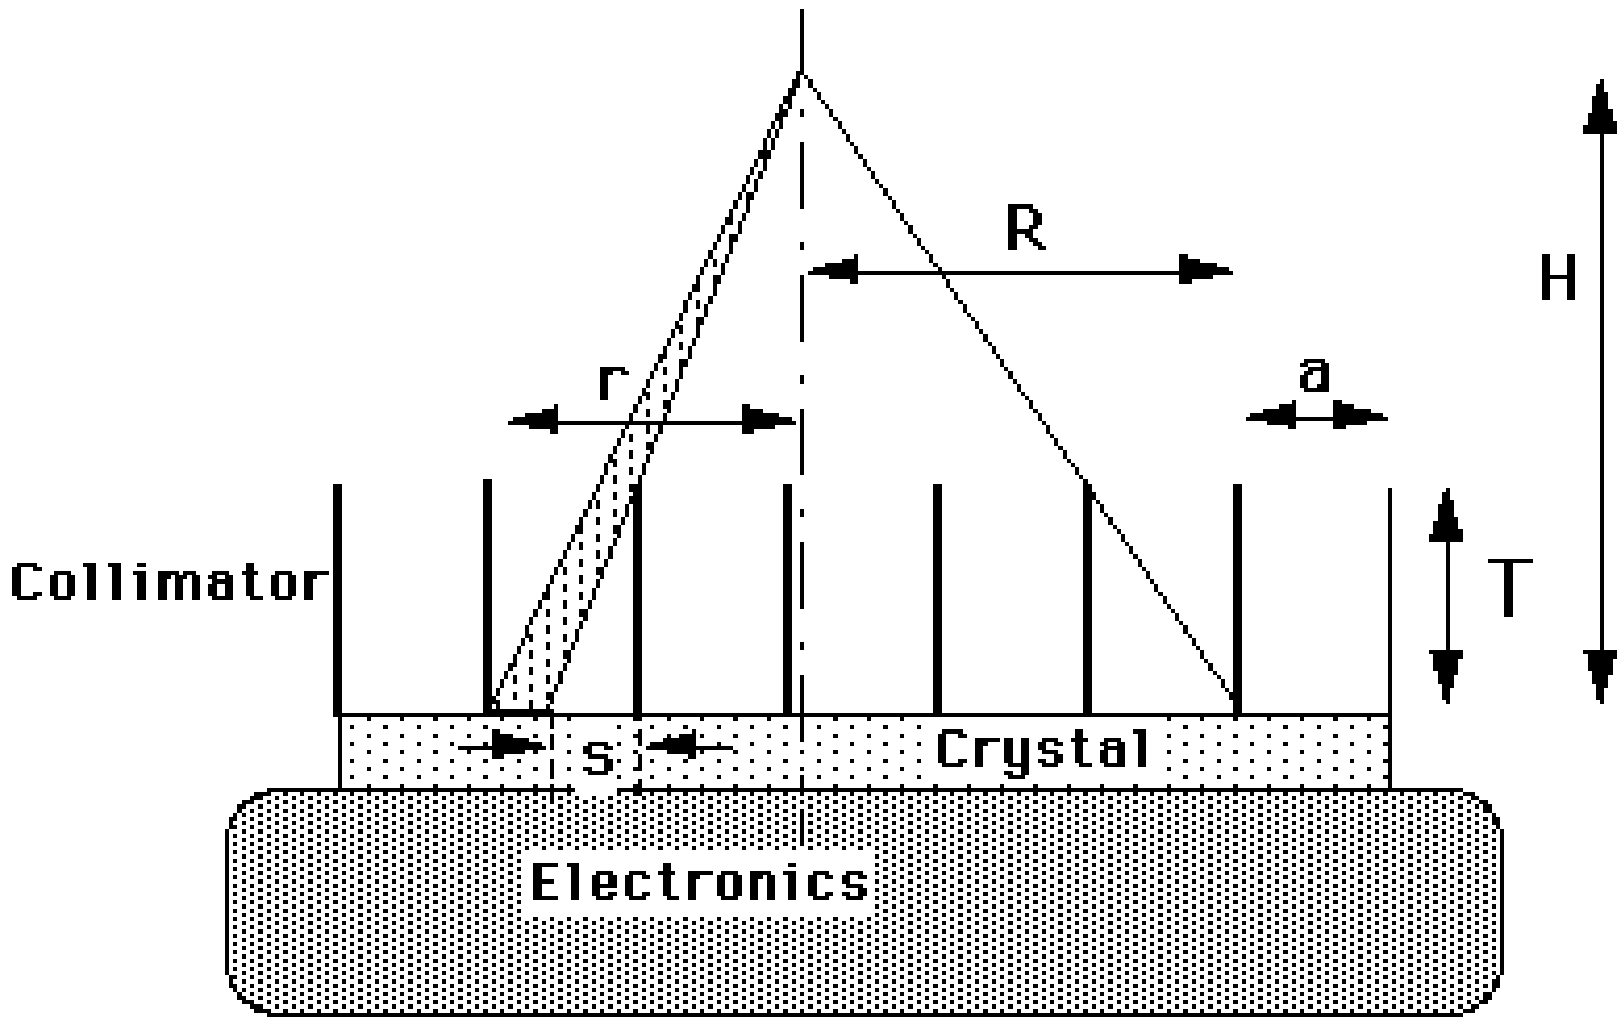
Figure 7:Parallel hole collimator.
Figure 7 shows the cross section of a parallel hole collimator with septa length and septa spacing . At a distance of , a radioactive point source is located. If the collimator would really absorb all photons except those propagating exactly perpendicular to the detector, then the image would be a point. However, Figure 7 shows that photons propagating along slightly inclined lines may also reach the detector. Therefore the image will not be a point. Because the image of a point is characteristic for the system, such images are often studied. By definition, the image of a point is the point spread function (PSF) of the imaging system.
Assume that the thickness of the septa can be ignored, that is large compared to the length of the septa , and that is large compared to . We will also ignore septal penetration (i.e. gamma-photons traveling through the septa instead of getting absorbed). The light (e.g. 140 keV photons) emitted by the source makes the septa cast a shadow on the detector surface. In fact, most of the detector is in that shadow, except for a small region facing the source. We will regard the center of that region, immediately under the source, as the origin of the detector plane. The length of the shadow cast by a septum on the detector is then
where is the distance to the origin. The fraction of the detector element that is actually detecting photons is
This expression holds for between 0 and , where is the position at which the shadow completely covers the detector so that . The expression gives the fraction of the photons detected at , relative to the number that would be detected at the same position if there was no collimator. This latter number is easy to compute. The source is emitting photons uniformly, so the number of photons per solid angle is constant. Stated otherwise, if we would put a point source in the center of a spherical uncollimated detector with radius , the detector surface would be uniformly irradiated. The total area of the sphere is , so the sensitivity per unit area is . Multiplying with the collimator sensitivity produces the point spread function of the collimated detector at distance :
In this expression, we have ignored the fact that for a flat detector, the distance to the point increases with . The approximation is fair if is much smaller than . Consequently, the PSF has a triangular profile, as illustrated in Figure 8.
To calculate (approximately) the total collimator sensitivity, expression (5) must be integrated over the region where PSF is non-zero. We assume circular symmetry and use integration instead of the summation (actually required by the discrete nature of the problem). Integration assumes that and are infinitely small. Since we use only the ratio, this poses no problems.
with
Note that a similar result is obtained if one assumes that the collimator consists of square grid of square holes. One finds:
In reality, the holes are usually hexagonal. With a septa length of 2 cm and septa spacing of 1 mm, about 1 in 5000 photons is passing through the collimator, according to equation (7). It is fortunate that the sensitivity does not depend on the distance .
It is easy to show that (8) is also equal to the FWHM of the PSF: you can verify by computing the FWHM from (5). So the FWHM of the spatial resolution increases linearly with the distance to the collimator! Therefore, the collimator must always be as close as possible to the patient, and failure to do so leads to important image degradation! Many gamma cameras have hardware to automically minimize the distance between patient and collimator during scanning.
To improve the resolution, the ratio must be decreased. However, the sensitivity is proportional to the square of . As a result, the collimator must be a compromise between high sensitivity and low FWHM.
The PSF is an important characteristic of the linear system, which allows us to predict how the system will react to any input. See appendix Convolution and PSF if you are not familiar with the concept of PSF and convolution integrals.
In section Resolution we have seen that the intrinsic resolution of a typical scintillation detector has a FWHM of about 4 mm. Now, we have seen that the collimator contributes significantly to the FWHM, but in the derivation, we have ignored the intrinsic resolution. Obviously, they have to be combined to obtain realistic results, so we must “superimpose” the two random processes. The probability distribution of each random process is described as a PSF. To compute the overall probability distribution, the second PSF must be “applied” to every point of the first one. Mathematically, this means that the two PSFs must be convolved. If we make the reasonable assumption that the PSFs are Gaussian, convolution becomes very simple, as shown in appendix Combining resolution effects: convolution of two Gaussians: the result is again a Gaussian, and its variance equals the sum of variances of the contributing Gaussians.
At distances larger than a few cm, the collimator PSF dominates the spatial resolution. The PSF increases in the order of half a cm per 10 cm distance, but there is a wide range: different types of collimator exist, either focusing on resolution or on sensitivity.
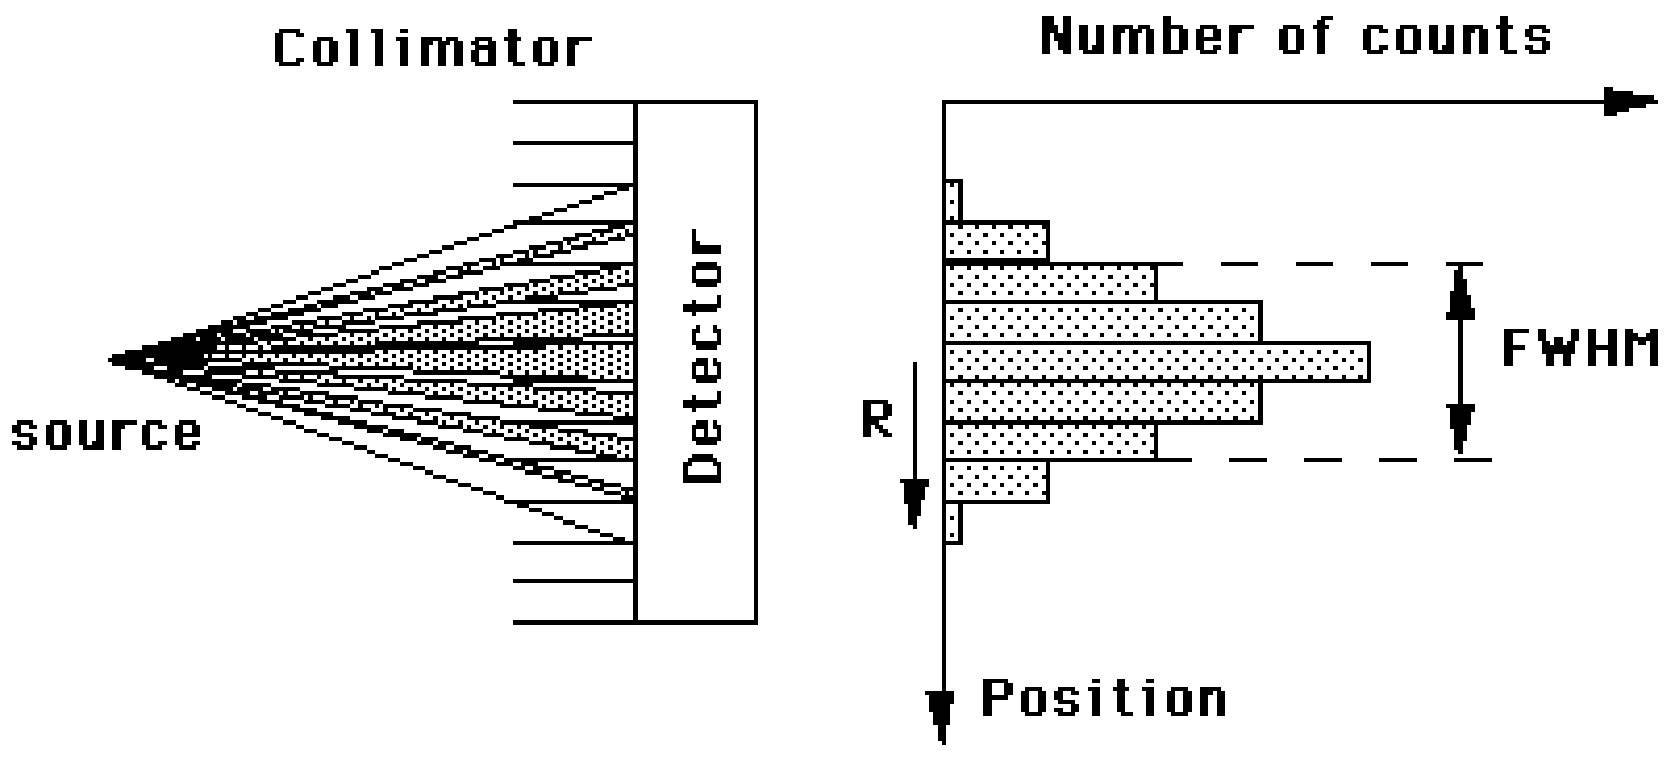
Figure 8:Point spread function of the collimator. The number of detected photons at a point in the detector decreases linearly with the distance to the central point.
In the calculations above, the thickness of the septa has been ignored. In reality, the septa have to be thick enough to stop the photons hitting them. Septa are made from high-Z materials, like lead or tungsten, to maximize the photon attenuation. High resolution collimators are optimized for imaging with 99mTc: the septa are relatively thin, and is small, resulting in high resolution but not so high sensitivity. High sensitivity collimators have a larger , producing poorer resolution. High energy collimators are designed for isotopes emitting high energy photons, such as 131I (see Table 1). They have thicker septa to minimize the number of photons penetrating them. To account for the septa thickness, equation (7) can be extended to
where is the distance between neighboring septa and is the septa thickness. Using thicker septa while keeping the resolution reduces the collimator sensitivity.
Electronic and mechanical collimation in the PET camera
Electronic collimation: coincidence detection
During positron annihilation, two photons are emitted in opposite directions. If both are detected, we know that the annihilation occurred somewhere on the line connecting the two detectors. So in contrast to SPECT, no mechanical collimator is needed. However, we need fast electronics, since the only way to test if two detected photons could belong together, is by checking if they have been emitted simultaneously.
We first consider a single detector pair as shown in Figure 9, and study its characteristics by computing its response to a point source. The detector has a square surface of size , and the distance between the detectors is . We choose the origin in the point of symmetry, and see how the response changes if we change the position of the point source. Keep in mind that an event is only valid if both photons of the photon pair are detected.

Figure 9:A point source positioned in the field of view of a pair of detectors
.
Assume that the point source is moved along the -axis: . Then the limiting detector is the far one: if one photon reaches the far detector, the other photon will surely reach the other detector. The number of detected photon pairs is proportional to the solid angle occupied by the two detectors:
This is an approximation: we assume that the far detector surface coincides with the surface of a sphere of radius . It does not, because it is flat. However, because is very small compared to , the approximation is very good.
We now move the point source vertically over a distance . As long as the point is between the dashed lines in Figure 9, nothing changes (that is, if we ignore the small decrease in solid angle due to the fact that the detector surface is now slightly tilted when viewed from the point source). However, when the point crosses the dashed line, the far detector is no longer fully irradiated. A part of the detector surface no longer contributes: if a photon reaches that part, the other photon will miss the other detector. The height is computed from simple geometry (Figure 9):
The first factor is the distance between the point and the dashed line, the second factor is the magnification due to projection of that distance to the far detector. This equation is only valid when . Otherwise, if is smaller than , and if is larger. In the center, and we have simply that . Knowing the active detector area, we can immediately compute the corresponding solid angle to obtain the detector pair sensitivity as a function of the point source position (which can be regarded as a PSF):
We can move the point also in the third dimension, which we will call . The effect is identical to that of changing , so we obtain:
From these equations it follows that the PSF is triangular in the center, rectangular close to the detectors and trapezoidal in between. Introducing that third dimension, we obtain for the PSF in the center and close to the detector respectively:
We can compute the average sensitivity within the field of view by integrating the PSF over the detector area and divide by . It is simple to verify that in both cases we obtain:
showing that sensitivity is independent of position in the detection plane, if the object is large compared to .
Finally, we can estimate the sensitivity of a complete PET system consisting of a detector ring with thickness and radius , assuming that we have a positron emitting source near the center of the ring. We assume that the ring is in the -plane, so the -axis is the symmetry axis of the detector ring. One approach is to divide the detector area by the area of a sphere with radius , as we have done before. This yields:
This is the maximum sensitivity, obtained for . The average over is half that value, since in the center of the PET, the sensitivity varies linearly between the maximum and zero:
Resolution of coincidence detection
Until now, we have always assumed that annihilation takes place very close to the emission point, and that the photons are emitted in exactly opposite directions. In reality, there are small deviations, which limit the theoretical resolution of PET.
Table 2:Maximum and mean kinetic energy (k.e.), maximum and mean path length of the positron for the most common PET isotopes.
Isotope | Max k.e. [MeV] | mean k.e. [MeV] | Max path [mm] | Mean path [mm] |
11C | 0.96 | 0.39 | 3.9 | 1.1 |
13N | 1.19 | 0.49 | 5.1 | 1.5 |
15O | 1.72 | 0.73 | 8.0 | 2.5 |
18F | 0.64 | 0.25 | 2.4 | 0.6 |
68Ga | 1.90 | 0.85 | 8.9 | 2.9 |
82Rb | 3.35 | 1.47 | 17 | 5.9 |
As shown in Table 2, the path depends on the kinetic energy of the positron. The positron can only annihilate if its kinetic energy is sufficiently low, so if it is emitted at high speed, it will travel “far” (up to a few mm). During its trajectory, it dissipates its energy in collisions with surrounding electrons. The mean path length (positron range) of 18F is small and has a very limited effect on the spatial resolution. For some other isotopes, like 68Ga and 82Rb, the positron range is several mm.
Momentum is preserved during annihilation, so the momentum of both photons must equal the momentum of the positron and the electron. This momentum is usually not zero, so the photons cannot be emitted in exactly opposite directions (the momentum of a photon is a vector with amplitude and pointing in the direction of propagation). As shown in Figure 10, there is a deviation of about 0.5º, which corresponds to a 2.0 mm offset for a detector ring with 80 cm diameter.
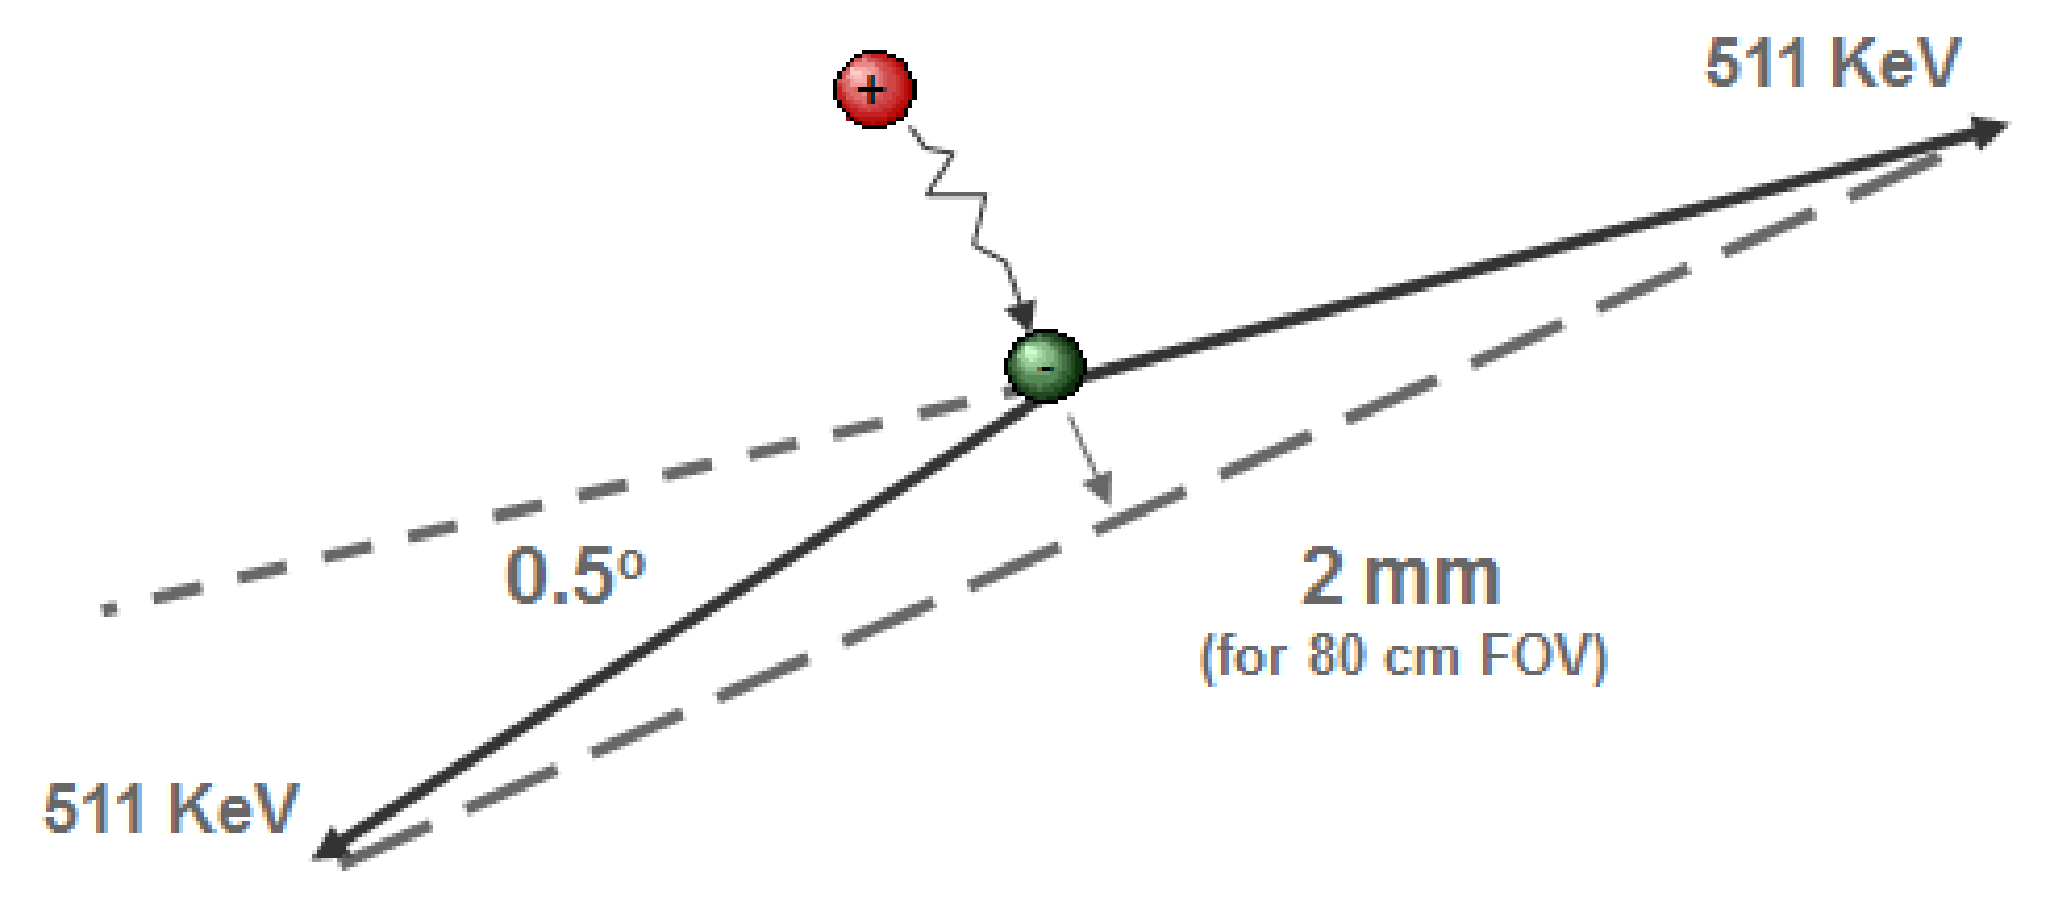
Figure 10:The distance traveled by the positron and the deviation from 180 degrees in the angle between the photon paths limit the best achievable resolution in PET
.

Figure 11:Resolution loss as a result of uncertainty about the depth of interaction
.
The resolution is further degraded by the unknown “depth of interaction” of the photon inside the crystal. As shown in Figure 11, photons emitted near the edge of the field of view might traverse one crystal to scintillate only in the next one. Because we don’t know where in the crystal the scintillation took place, we always have to assign a fixed depth of interaction to the event. The mispositioning of these events causes a loss of resolution that increases with the distance from the center. PET systems have been designed and built that can measure the depth of interaction to reduce this loss of resolution.
Mechanical collimation: inter-plane septa
In the previous section we have seen why a PET-camera does not need a collimator. We also know that the PET-camera can only measure photon pairs originating somewhere within the detection plane. However, photons coming from radioactivity outside that plane could also reach the detectors, and produce undesired scintillations, which provide no information, or even worse, wrong information. Therefore, it is useful to shield the detector ring against photons coming from outside the field of view. This is done with so-called septa, as shown in Figure 12. The septa provide some collimation in the direction perpendicular to the detection plane, but there is no collimation within the plane. The septa reduce the number of single photons, scattered photons, random coincidences and triple (or more) coincidences.
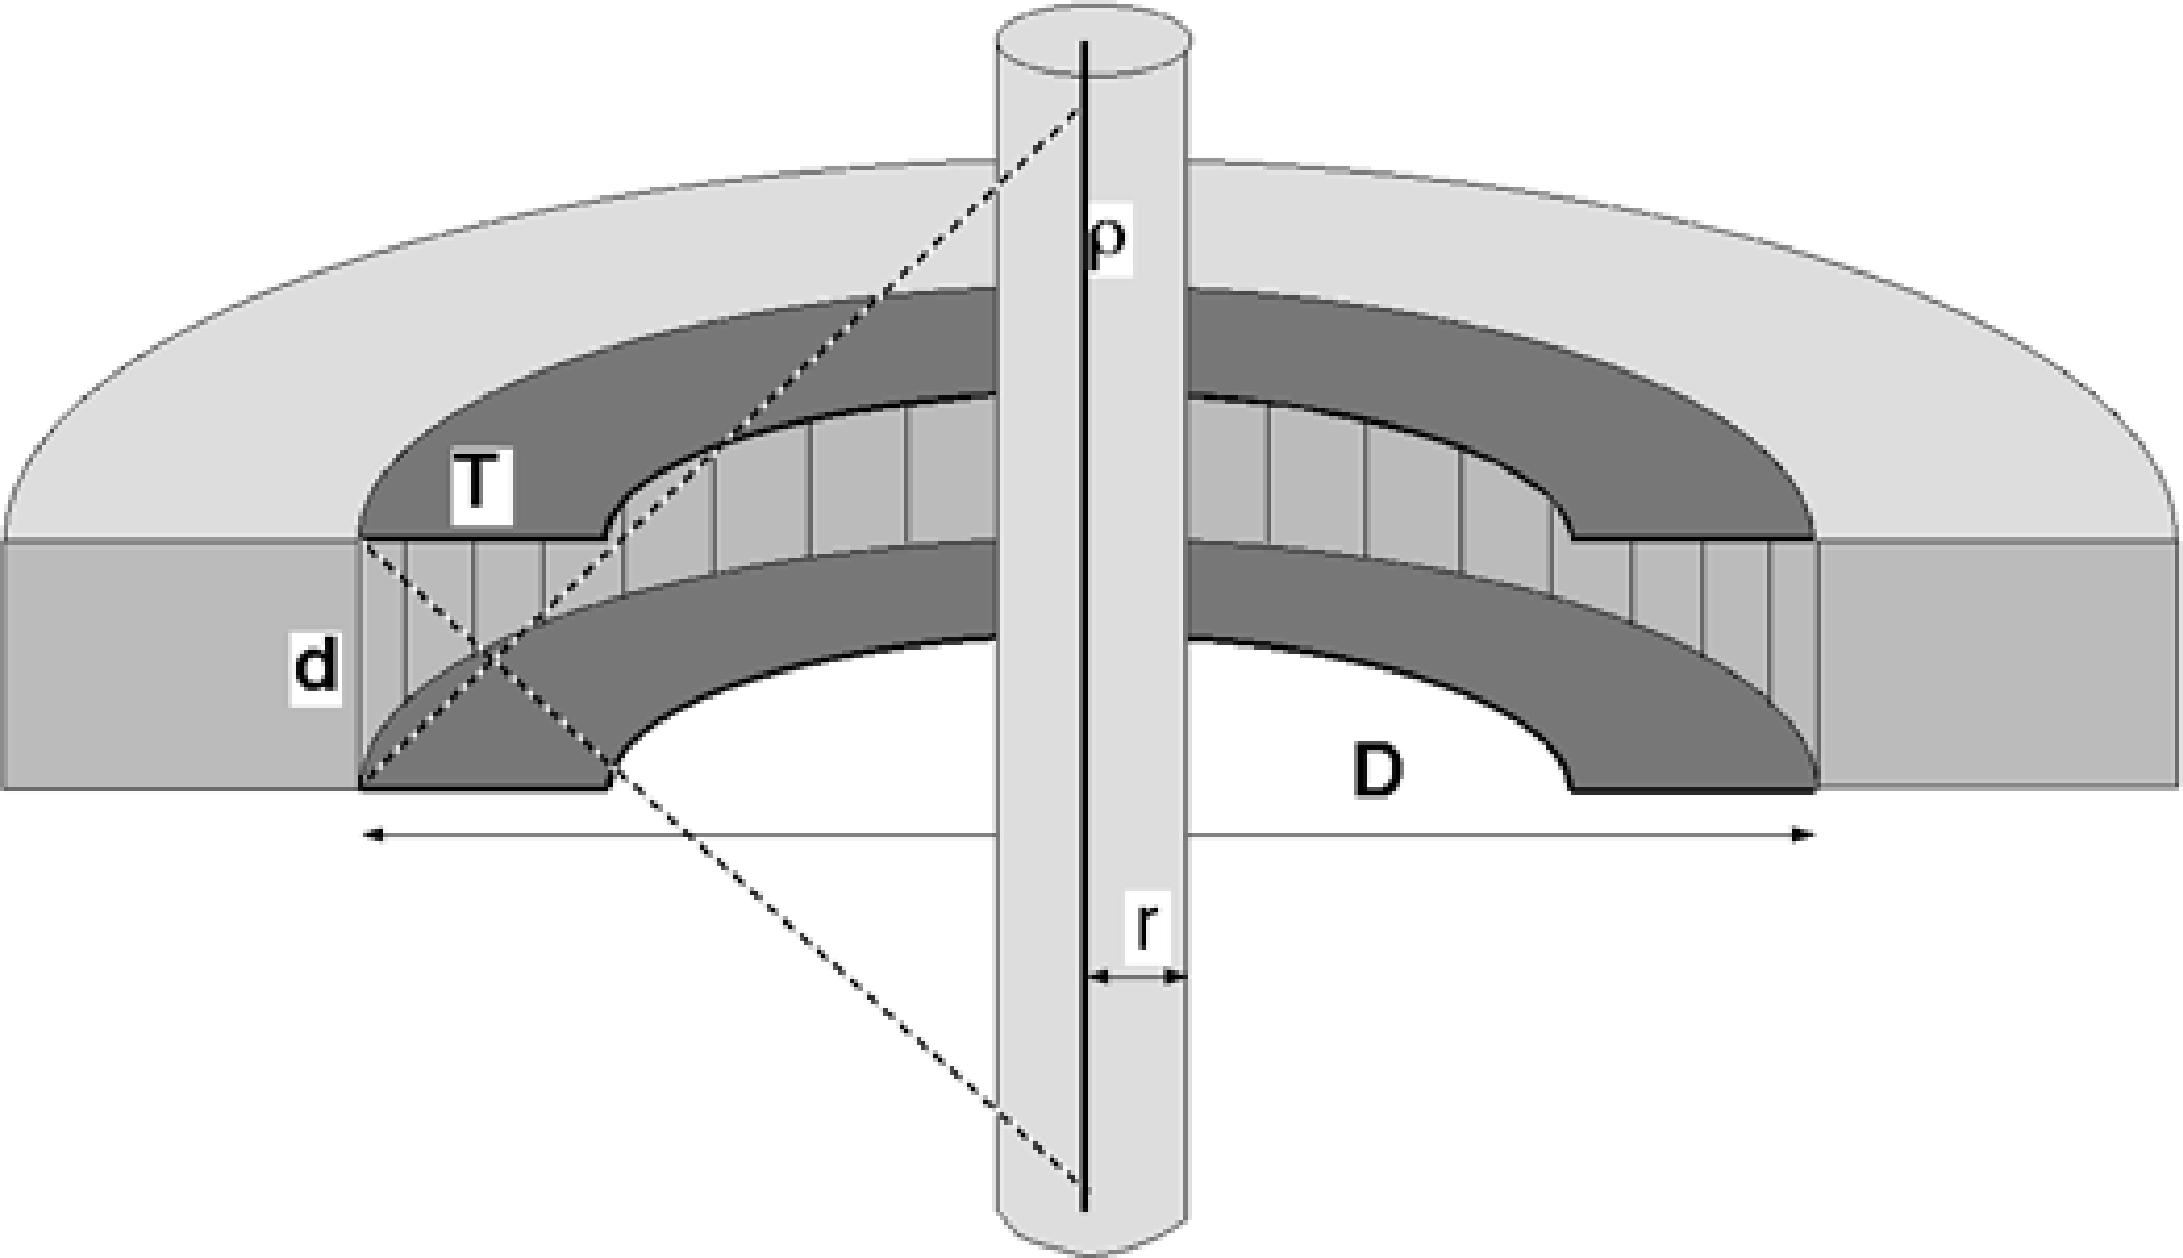
Figure 12:A PET ring detector (cut in half) with a cylindrical homogeneous object, containing a radioactive wire near the symmetry axis
.
Before these events are described, we have to better define what is meant with a coincidence. Two photons are detected simultaneously if the difference in detection times is lower than a predefined threshold, the “time window” of the PET-system. The time window cannot be arbitrarily short for the following reasons:
The time resolution of the electronics is limited: electricity is never faster than light, and it is delayed in every electronical component. Of course, we do not want to reject true coincidences because of errors in timing computation.
The diameter of the PET-camera is typically about 1 m for a whole body system, and about half that for a brain system. Light travels about 1 m in 3 ns. Consequently, the time window should not be below 3 ns for a 1 m diameter system.
For these reasons, current systems use a time window of about 5 to 10 ns. Recently, PET systems have been built with a time resolution better than 1 ns. With those systems, one can measure the difference in arrival time between the two photons and deduce some position information from it. This will be discussed in section Time-of-flight PET.
Figure 13 shows the difference between a true coincidence, which provides valuable information, and several other events which are disturbing or even misleading. A single event provides no information and is harmless. But if two single events are simultaneous (random coincidence), they are indistinguishable from a true coincidence. If one (or both) of the photons is scattered, the coincidence provides wrong information: the decaying atom is not located on the line connecting the two detectors. Finally, a single event may be simultaneous with a true coincidence. Since there is no way to find out which of the three photons is the single one, the entire event is ignored and information is lost.

Figure 13:True coincidence, scattered coincidence, single event, random coincidence
.
To see how the septa dimensions influence the relative contribution of the various possible events, some simple computations can be carried out using the geometry shown in Figure 12. Assume that we have a cylindrical object in the PET-camera. In the center of the cylinder, there is a radioactive wire, with activity ρ per unit length. The cylinder has radius and attenuation coefficient μ. This object represents an idealized patient: there is activity, attenuation and Compton scatter in the attenuating object as in a patient; the unrealistic choice of dimensions makes the computations easier. The PET-camera diameter is , the detector size is and the septa have length . The duration of the time window is τ. Finally, we assume that the detector efficiency is ε, which means that if a photon reaches the detector, it has a chance of ε to produce a valid scintillation, and a chance of to remain undetected.
To compute the number of true coincidences per unit of time, we must keep in mind that both photons must be detected, but that their paths are not independent. To take into account the influence of the time window, it helps to consider first a short time interval equal to the time window τ. After that, we convert the result to counts per unit of time by dividing by τ. Why we do this will become clear when dealing with randoms. We proceed as follows:
The activity in the field of view is .
Both photons can be attenuated, the attenuated activity is , with .
As we have derived above (see equation (18)), the geometrical sensitivity is .
Both photons must be detected if they hit the detectors, so the effective sensitivity is .
The probability that a photon will be seen is proportional to the scan time τ.
To compute the number of counts per time unit, we multiply with .
We only care about the influence of the design parameters, so we ignore all constants. This leads to:
For scatters the situation is very similar, except for two issues: (1) the probability for a scatter event to occur depends on the attenuating material and (2), the combined photon path is not a straight line but a broken one.
Consider a source with activity λ emitting photons at along the -axis, in a material with linear attenuation coefficient μ that covers the interval . Then the probability of a photon arriving at is proportional to , and the probability that it scatters there is proportional to . The probability that this scattered photon will not be attenuated is determined by how much material it is propagating through, and can be roughly estimated as . To obtain all scattered photons leaving the object we integrate this from the source position to the boundary of the material:
where the last equation is obtained by setting .
The other issue is that the combined photon path is a broken line. This has two consequences. First, the field of view is larger than for the trues. Second, the path of the second photon is (nearly) independent of that of the first one.
We will assume that only one of the photons undergoes a single Compton scatter event, so the path contains only a single break point. The corresponding field of view is indicated with the dashed line in Figure 12. The length of the wire in the field of view is then , but since is much smaller than we approximate it as .
Each of the photons goes its own way. This will only lead to detection if both happen to end up on a detector and are detected. For each of them, that probability is proportional to , so for the pair the detection probability is . For the trues this factor was not squared, because detection of one photon guarantees detection of the other!
Attenuation of scattered photons is complex, since they have lower energy and travel along oblique lines. However, if we assume that the septa are not too short and that the energy resolution is not too bad, we can ignore all that without making too dramatic an error. (We only want to see the major dependencies, so we can live with moderately dramatic errors.) Consequently, we have for the scatters count rate
A single, non-scattered photon travels along a straight line, so the singles field of view is the same as that of the scatters, and the contributing activity is . The attenuation is . The effective sensitivity is proportional to . The number of singles in a time τ is proportional to τ. Finally, we divide by τ to obtain the number of single events per unit of time. This yields:
A random coincidence consists of two singles, arriving simultaneously. So if we study a short time interval τ equal to the time window, we must simply multiply the probabilities of the two singles, since they are entirely independent of each other. Afterwards, we multiply with to compute the number of counts per time unit. So we obtain:
Similarly, we can compute the probability of a “triple coincidence”, resulting from simultaneous detection of a true coincidence and a single event. This produces:
As you can see, the trues count rate is not affected by either τ nor , in contrast to the unwanted events. Consequently, we want τ to be as short as possible to reduce the randoms and triples count rate. We have seen that for current systems this is about 10 ns or even less. Similarly, we want to be as large as possible to reduce all unwanted events. Obviously, we need to leave some room for the patient.
2D and 3D PET
In the previous paragraphs we have studied a single ring of PET detectors, and we have shown that shielding the detectors with septa reduces the scatter and random coincidence rate, without affecting the true coincidence rate. In current clinical systems, multiple rings are combined in a single device, as shown in Figure 14. In the past, many of these systems could be operated in two modes. In 2D-mode, the rings are separated by septa. In 3D-mode, the septa are retracted, only the shielding at the edges of the axial field of view remain. Current PET systems have no septa between the detector rings, they are always operated in 3D mode.
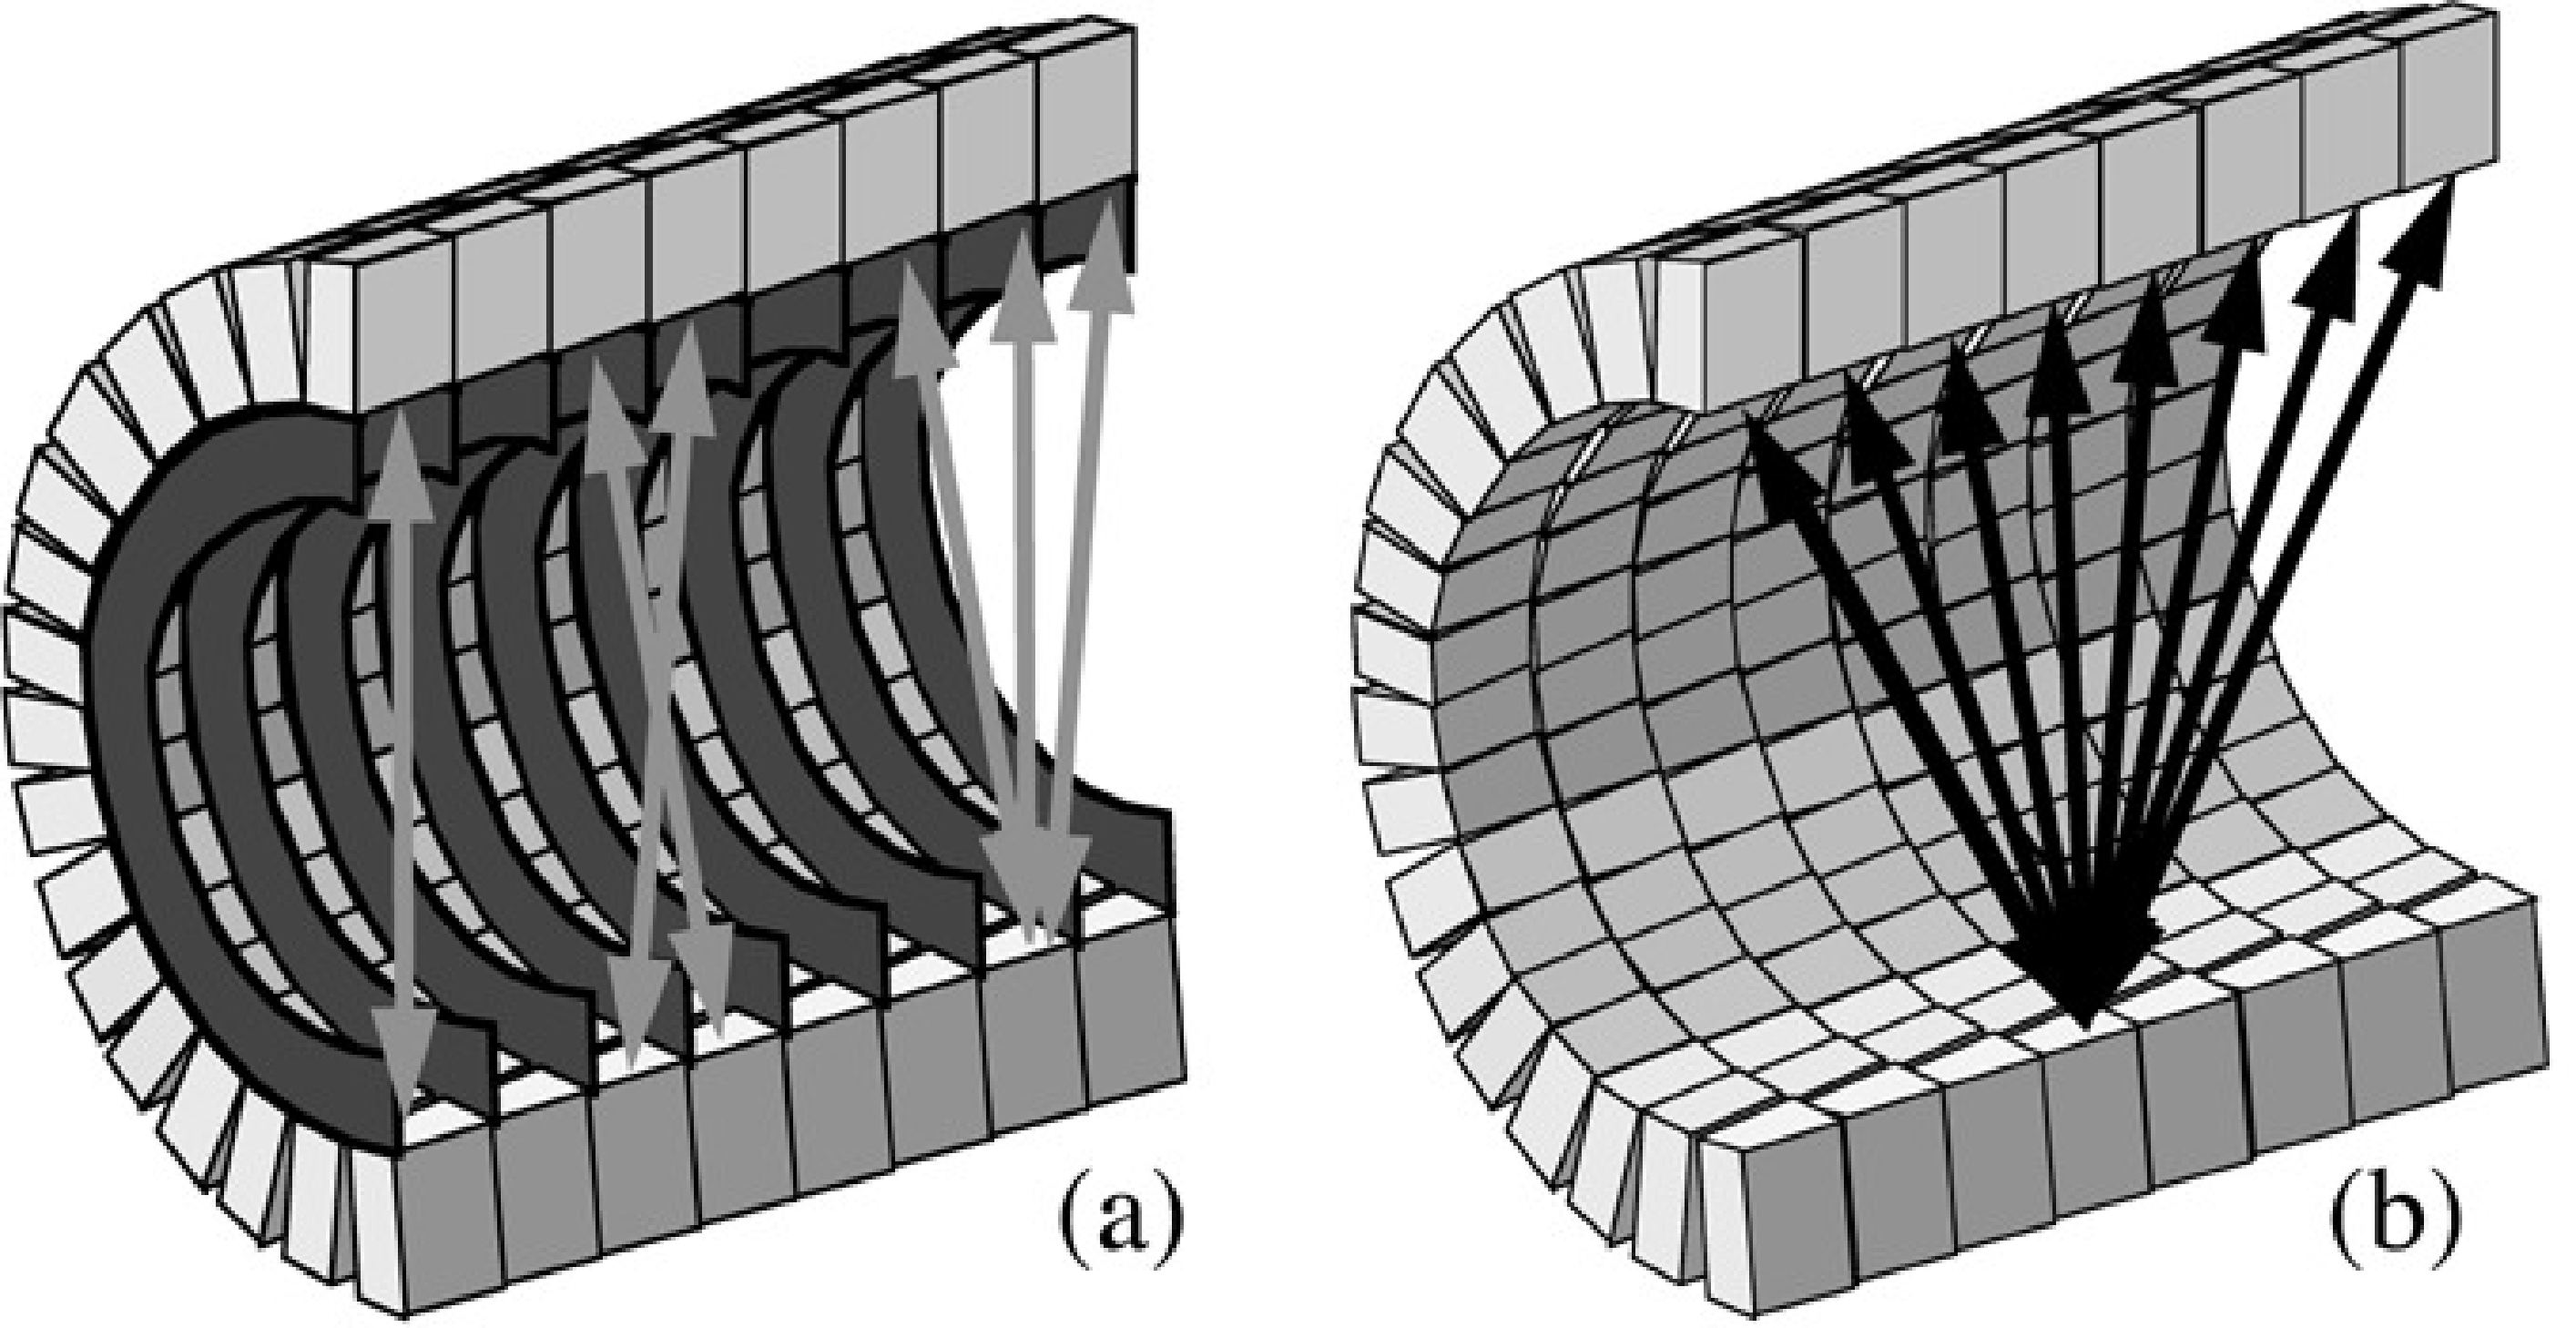
Figure 14:Positron emission tomograph (cut in half). When septa are in the field of view (a), the camera can be regarded as a series of separate 2D systems. Coincidences along oblique projection lines between neighboring rings can be treated as parallel projection lines from an intermediate plane. This doubles axial sampling: 15 planes are reconstructed from 8 rings. Retracting the septa (b), increases the number of projection lines and hence the sensitivity of the system, but fully 3D reconstruction is required.
In 2D mode, there are two types of planes: direct planes, located in the center of the ring, and cross-planes, located between two neighboring rings. The direct planes correspond to what we have seen above for a single ring system. A photon pair belongs to a cross plane if one photon is detected in ring and the other one in ring . The small inclination of the projection line can be ignored, and such coincidences are processed as if they were acquired by an imaginary detector ring located at . This improves axial sampling. It turns out that the cross-planes are in fact superior to the direct planes: near the center the axial resolution is slightly better because of the shadow cast by the septa on the contributing detectors, and the sensitivity is nearly twice that of direct planes because of the larger solid angle.
According to the Nyquist criterion, the sampling distance should not be longer than half the period of the highest special frequency component in the acquired signal (you need at least two samples per period to represent a sine correctly). Without the cross-planes, the criterion would be violated. So the cross-planes are not only useful to increase sensitivity, the are needed to avoid aliasing as well.\
In 3D mode, the septa are retracted, except for the first and last one. The detection is no longer restricted to parallel planes, photon pairs traveling along oblique lines are now accepted as well. In chapter Image formation we will see that this has a strong impact on image reconstruction.
This has no effect on spatial resolution, since that is determined by the detector size. But the impact on sensitivity is very high. In fact, we have already computed all the sensitivities in section Mechanical collimation: inter-plane septa. Those expressions are still valid for 3D PET, if we replace (the distance between the septa) with , where is the number of neighboring detector rings. To see the improvement for 3D mode, you have to compare to a concatenation of independent detector rings (2D mode), which are times more sensitive than a single ring (at least if we wish to scan an axial range larger than that seen by a single ring). So you can see that the sensitivity for trues increases with a factor of when going from 2D to 3D. However, scatters increase with and randoms even with . Because the 3D PET is more sensitive, we can decrease the injected dose with a factor of (preserving the count rate). If we do that, randoms will only increase with . Consequently, the price we pay for increased sensitivity is an even larger increase of disturbing events. So scatter and randoms correction will be more important in 3D PET than in 2D PET. It turns out that scatter in particular poses problems: it was usually ignored in 2D PET, but this is no longer acceptable in 3D PET. Various scatter correction algorithms for 3D PET have been proposed in the literature, the one mostly used is described below (PET camera).
Partial volume effect

Figure 15:The partial volume effect caused by the finite pixel size (left), and by the finite system PSF (right). The first row shows the true objects, the second row illustrates the partial volume effect due to pixels and PSF, and the last row compares horizontal profiles to the true objects and the images. Objects that are small compared to the pixel size and/or the PSF are poorly represented.
As explained above, resolution is not the strongest point of nuclear medicine. Other medical imaging systems (CT, MR, ultrasound) have a much better resolution. One often uses the term partial volume effect to refer to problems caused by poor resolution. The idea is that if an object only fills part of a pixel, the pixel contains two things: object and background. Because the pixel has only one value, it does not give a reliable representation of either. Figure 15 illustrates this for a disk imaged with some imaging system. If the object is large compared to the pixels of the image, then the image gives a good representation of the object. However, small objects are poorly represented. As can be seen in the profiles, the maximum value in the image is much smaller than the true maximum intensity of the object. The obvious remedy is to use sufficiently small pixels.
However, if the pixels are small, the imaging performance is limited by the system point spread function, as illustrated in the second panel of Figure 15. The image can be regarded as a convolution of the true intensities with the PSF. The effect is very similar as that of the big pixels, one could say that the object only partially fills the PSF. Again, the maximum intensity of small objects is severely underestimated, and their size is overestimated.
Consequently, nuclear medicine imaging systems tend to underestimate the maximum intensity and overestimate the size of small objects. The recovery coefficient is the ratio of the estimated and true maximum. The so-called spill over is the amount of apparent activity showing up outside the true object boundaries due to the blurring.
Compton scatter correction
Gamma camera
Compton scatter causes photons to be deviated from their original trajectory, and to propagate with reduced energy along a new path. Consequently, photons with reduced energy can reach the detector via a broken line. Such photons are harmful: they provide no useful information and produce an unwanted inhomogeneous background in the acquired images (Figure 16).
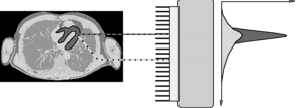
Figure 16:Compton scatter allows photons to reach the camera via a broken line. These photons produce a smooth background in the acquired projection data.
We have seen in section Compton scatter that the photon loses more energy for larger scatter angles. The gamma camera (or the PET camera) measures the energy of the photon, so it can reject the photon if its energy is low.
However, if the energy loss during Compton scatter is smaller than or comparable to the energy resolution of the gamma camera, then it may survive the energy test and get accepted by the camera. Figure 17 shows the energy spectrum as measured by the gamma camera. A Monte Carlo simulation was carried out as well, and the resulting spectrum is very similar to the measured one. The simulation allows to compute the contribution of unscattered (or primary) photons, photons that scattered once and photons that suffered multiple scatter events. If the energy resolution were perfect, the primary photon peak would be infinitely narrow and all scattered photons could be rejected. But with a realistic energy resolution the spectra overlap, and acceptance of scattered photons is unavoidable.
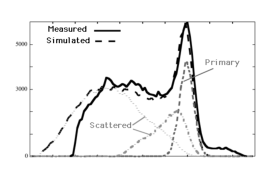
Figure 17:The energy spectrum measured by the gamma camera, with a simulation in overlay. The simulation allows to compute the spectrum of non-scattered (primary) photons, single scatters and multiple scatters. The true primary spectrum is very narrow, the measured one is widened by the limited energy resolution.
Figure 17 shows a deviation between simulation and measurement for high energies. In the measurement it happens that two photons arrive simultaneously. If that occurs, the gamma camera adds their energies and averages their position, producing a mispositioned count with high energy. Such photons must be rejected as well. The simulator assumed that each photon was measured independently. The simulator deviates also at low energies from the measured spectrum, because the camera has not recorded these low-energy photons.
To reject as much as possible the unwanted photons, a narrow energy window is centered around the tracer energy peak, and all photons with energy outside that window are rejected. Current gamma cameras can use multiple energy windows simultaneously. That allows us to administer two or more different tracers to the patient at the same time, if we make sure that each tracer emits photons at a different energy. The gamma camera separates the photons based on their energy and produces a different image for each tracer. For example, 201Tl emits photons of about 70 keV (with a frequency of 0.70 per desintegration) and 80 keV (0.27 per desintegration), while 99mTc emits photons of about 140 keV (0.9 per desintegration). 201Tl labeled thallium chloride can be used as a tracer for myocardial blood perfusion. There are also 99mTc labeled perfusion tracers. These tracers are trapped in proportion to perfusion, and their distribution depends mostly on the perfusion at the time of injection. Protocols have been used to measure simultaneously or sequentially the perfusion of the heart under different conditions. In one such protocol, 201Tl is injected at rest, and a single energy scan is made. Then the patient exercises to induce the stress condition, the 99mTc tracer is injected at maximum excercise, and after 30 to 60 min, a scan with energy window at 140 keV is made. If the same tracer were used twice, the image of the stress perfusion would be contaminated by the tracer contribution injected previously at rest.
Since not all unwanted photons can be rejected, an additional correction may be required. Figure 18 shows a typical correction method based on three energy windows. Window C1 is the window centered on the energy of the primary photons. If we assume that the spectrum of the unwanted photons varies approximately linearly over the window C1, then we can estimate that spectrum by measuring in two additional windows C2 (just below C1) and C3 (just above C1). If all windows had the same size, then the number of unwanted photons in C1 could be estimated as (counts in C2 + counts in C3) / 2. Usually C2 and C3 are chosen narrower than C1, so the correction must be weighted accordingly. In the example of Figure 18 there are very few counts in C3. However, if we would use a second tracer with higher energy, then C3 would receive scattered photons from that tracer.
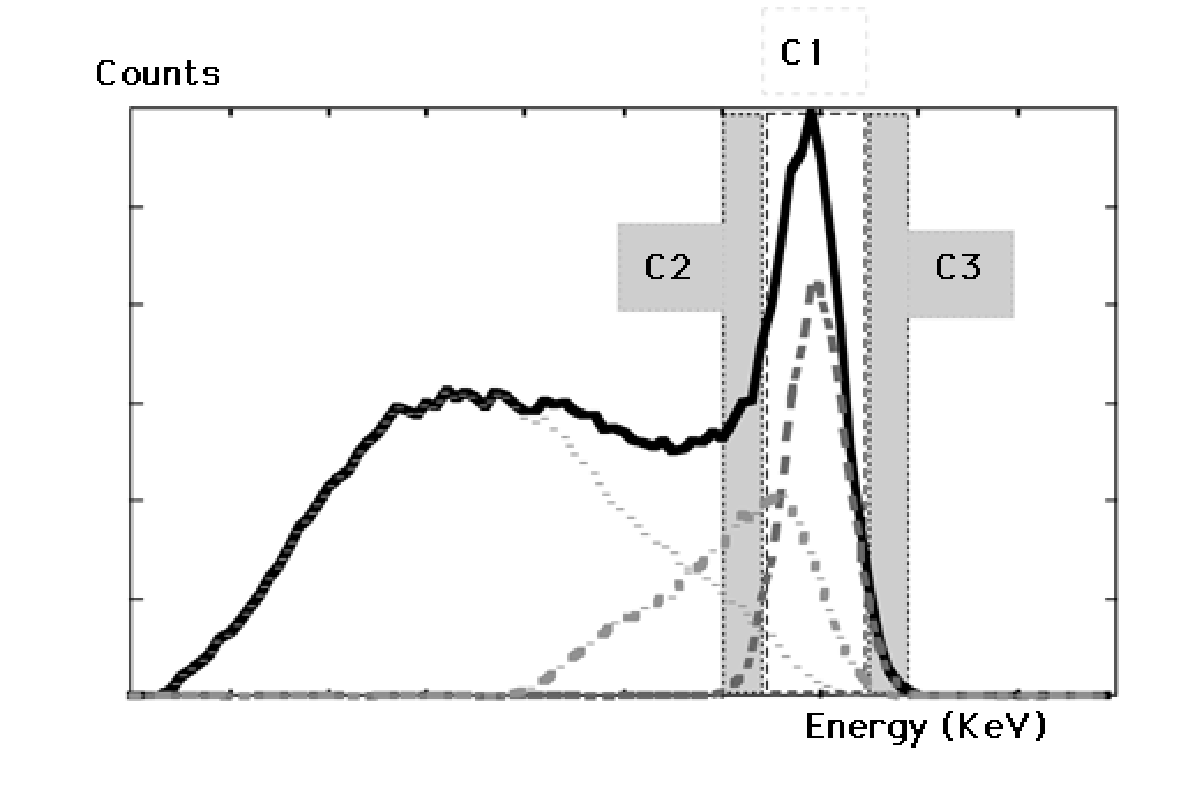
Figure 18:Triple energy window correction. The amount of scattered photons accepted in window C1 is estimated as a fraction of the counts in windows C2 and C3.
PET camera
Just like the gamma camera, the PET camera uses a primary energy window to reject photons with an energy that is clearly different from 511 keV. However, the energy resolution of current PET systems is poorer than that of the gamma camera (ca 10%). Unfortunately, with poorer energy resolution, scatter correction based on an additional energy window is less accurate. The reason is that the center of the scatter window C2 has to be shifted farther away from the primary energy peak, here 511 keV. Hence, the photons in that window have lost more energy, implying that they have been scattered over larger angles. Consequently, they are a poorer estimate of the scatter inside the primary window, which has been scattered over smaller angles.
For that reason, PET systems use a different approach to scatter correction. As will be seen in chapter Transmission scans, PET scanners are capable of measuring the attenuation coefficients of the patient body. This can be used to calculate an estimate of the Compton scatter contribution, if an estimate of the tracer distribution is available, and if the characteristics of the PET system are known. Such computations are done with Monte Carlo simulation. The simulator software “emits” photons in a similar way as nature does: more photons are emitted where more activity is present, and the photons are emitted in random (pseudo-random in the software) directions. In a similar way, photon-electron interactions are simulated, and each photon is followed until it is detected or lost for detection (e.g. because it flies in the wrong direction). This must be repeated for a sufficient amount of photons, in order to generate a reasonable estimate of the scatter contribution. Various clever tricks have been invented to accelerate the computations, such that the whole procedure can be done in a few minutes.
In practice, the method works as follows. First, a reconstruction of the tracer uptake without scatter correction is computed. Based on this tracer distribution and on the attenuation image of the patient, the scatter contribution to the measured data is estimated with the simulation software. This scatter contribution can then be subtracted to produce a better reconstruction of the tracer distribution. This procedure can be iterated to refine the scatter estimate.
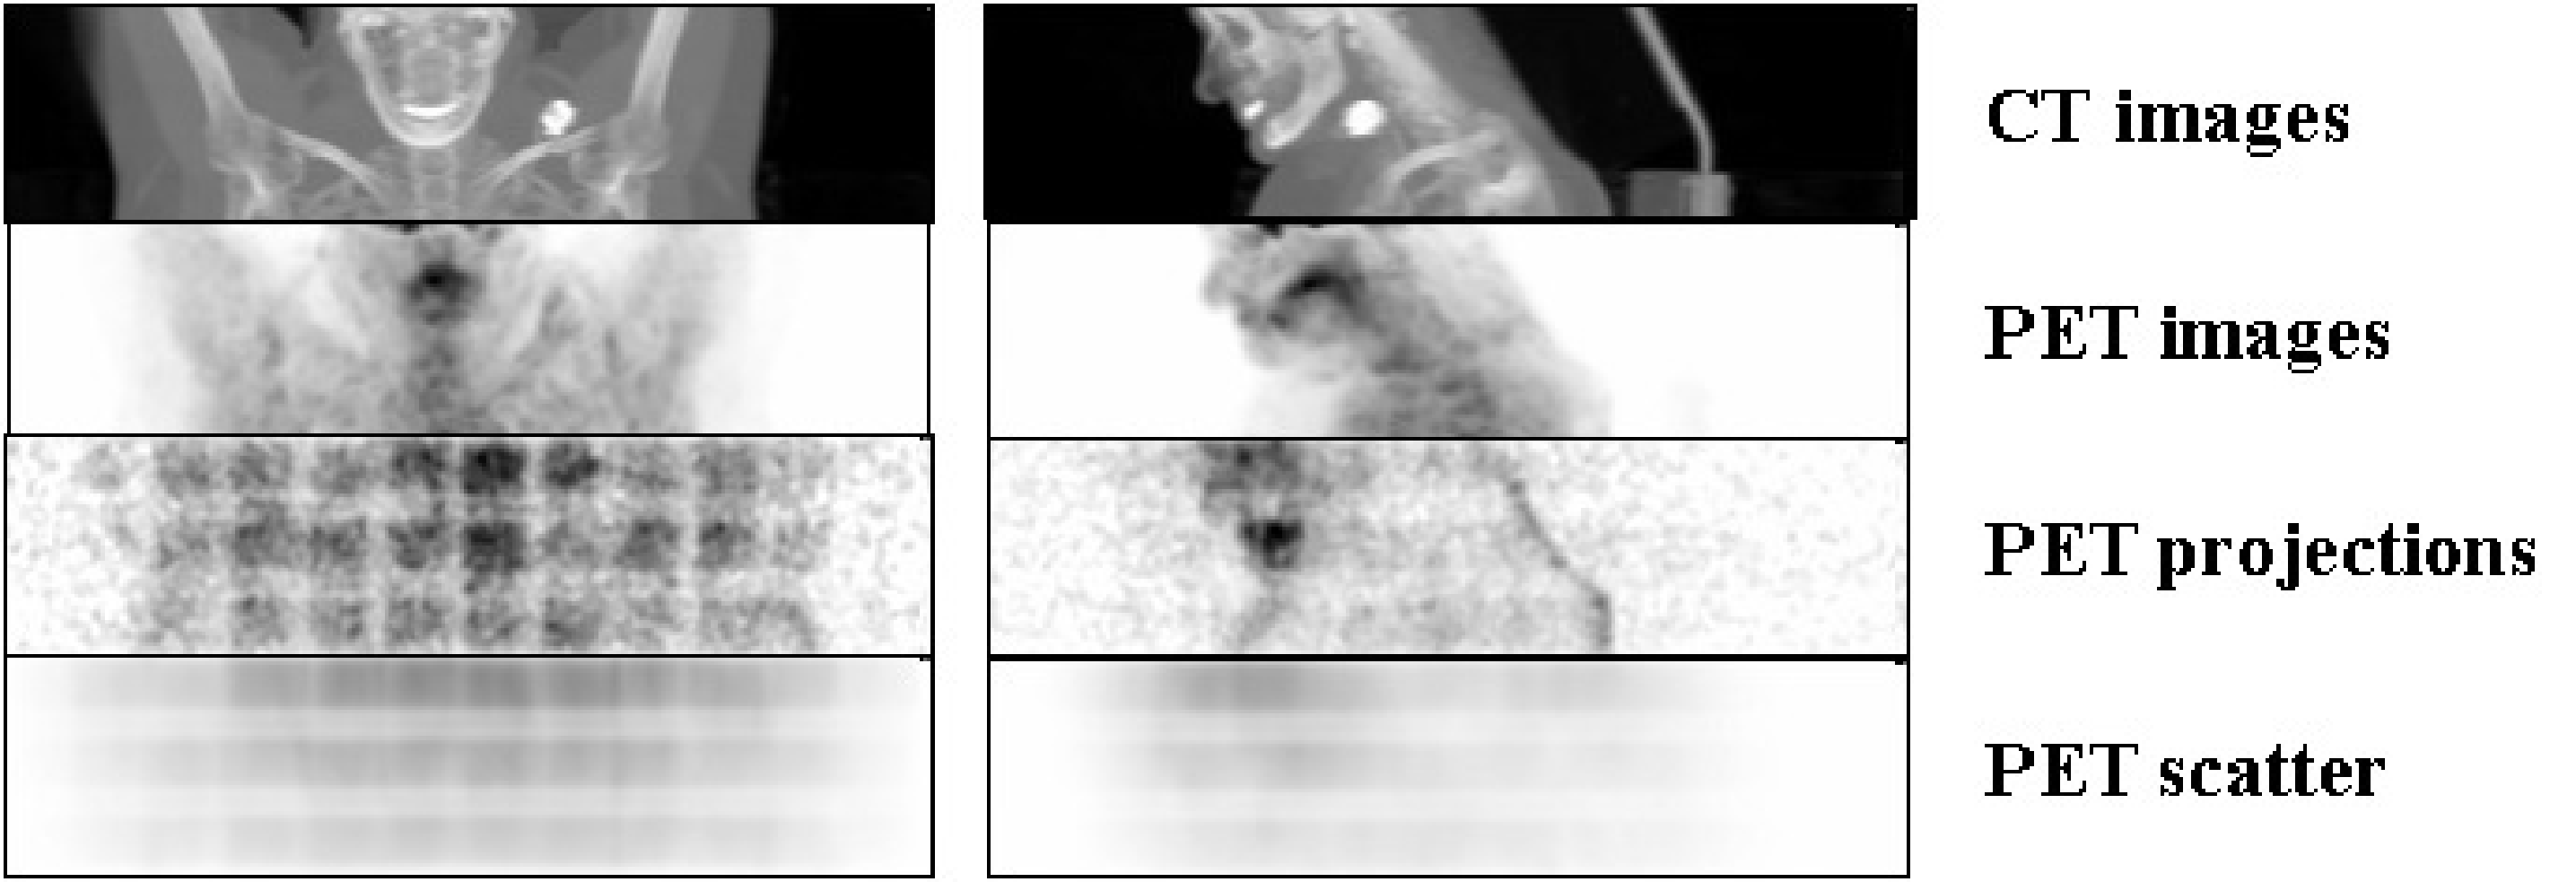
Figure 19:CT and PET images (obtained by maximum intensity projection), and the corresponding raw PET projection data with their estimated scatter contribution. Data were acquired with a Biograph 16 PET/CT system (Siemens). The regular pattern in the raw data is due to sensitivity differences between different detector pairs (see also Figure 23).
Figure 19 gives an example of the original raw PET data from a 3D PET scan (slightly smoothed so you would see something), together with the corresponding estimated scatter contribution (using the same gray scales). Maximum intensity projections of the CT and PET images are shown as well. The regular pattern in the raw PET data is due to position dependent sensitivities of the detector pairs (see also Figure 23). The scatter distribution is smooth, and its amplitude is significant.
Other corrections
Currently, most gamma camera designs are based on a single crystal detector as shown in Figure 20. To increase the sensitivity, a single gamma camera may have two or three detector heads, enabling simultaneous acquisition of two or three views along different angles simultaneously. Because the detector head represents a significant portion of the cost of the gamma camera, the price increases rapidly with the number of detector heads.
Most PET systems have a multi-crystal design, they consist of multiple rings (Figure 14) of small detectors. The detectors are usually arranged in modules (Figure 2) to reduce the number of PMT’s.
The performance of the PMT’s is not ideal for our purposes, and in addition they show small individual differences in their characteristics. In current gamma cameras and PET cameras the PMT-gain is computer controlled and procedures are available for automated PMT-tuning. But even after tuning, small differences in characteristics are still present. As a result, some corrections are required to ensure that the acquired information is reliable.
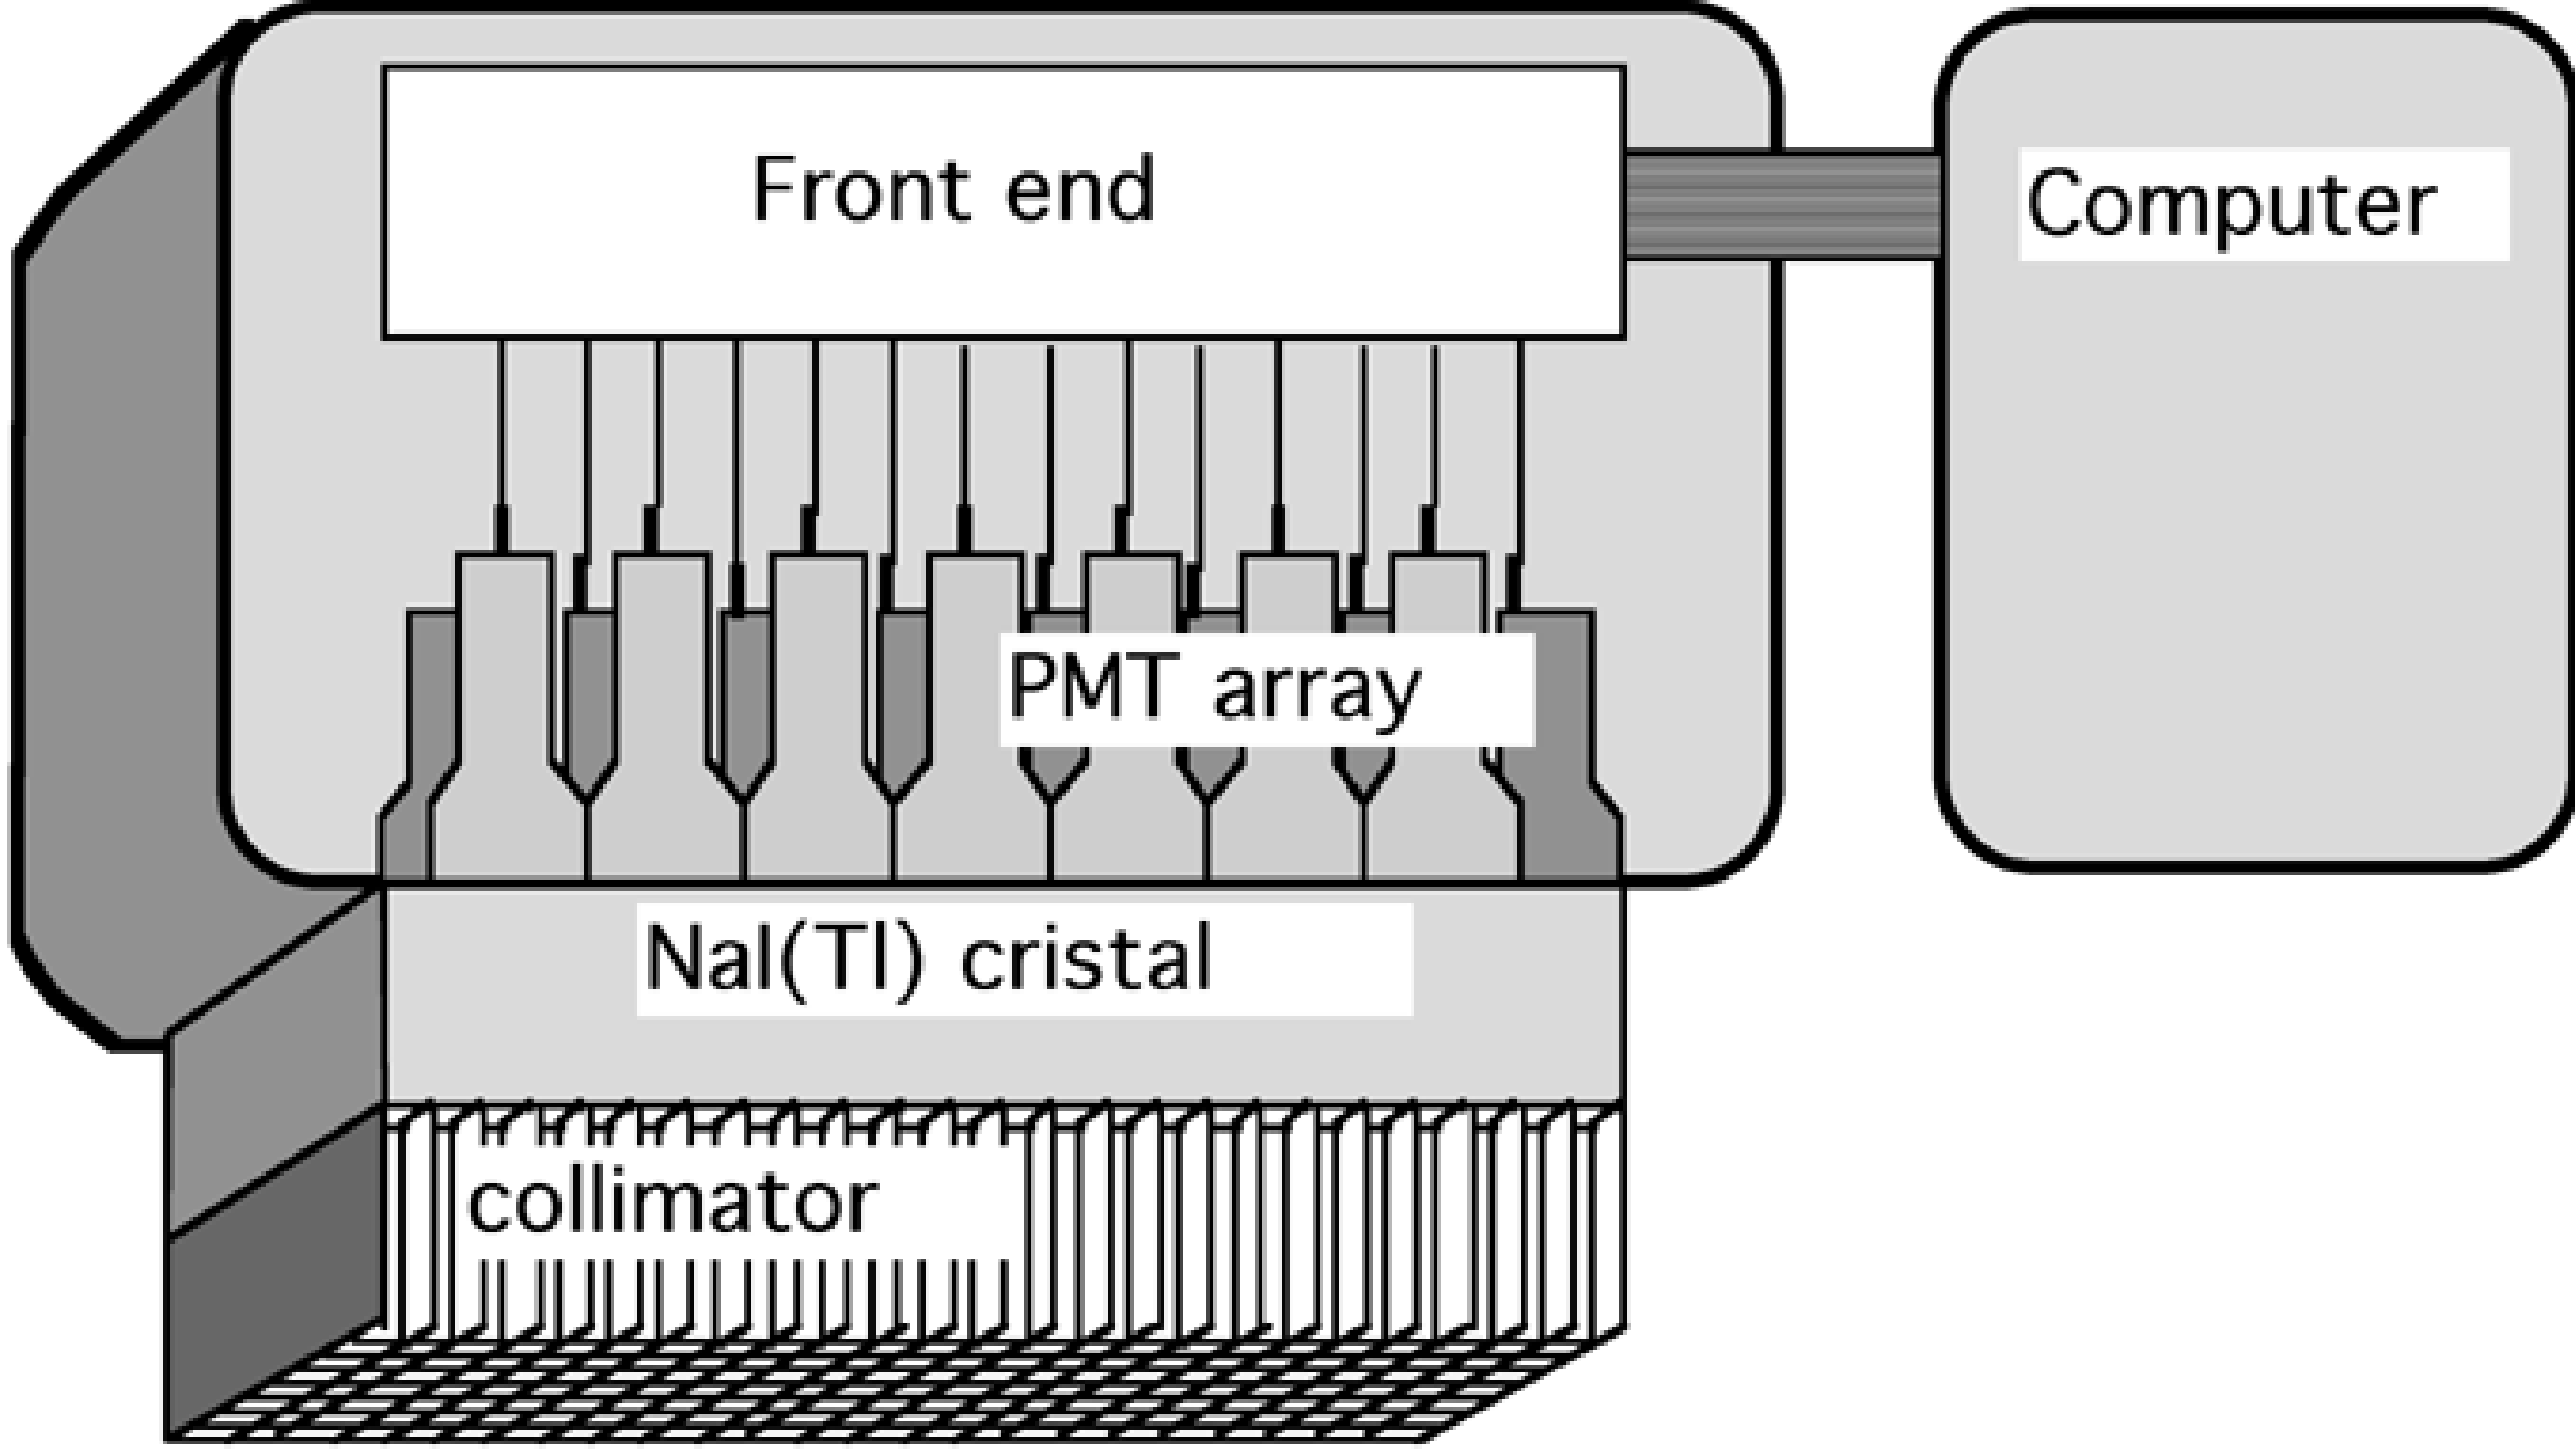
Figure 20:Schematic representation of a gamma camera with a single large scintillation crystal and parallel hole collimator.
Linearity correction
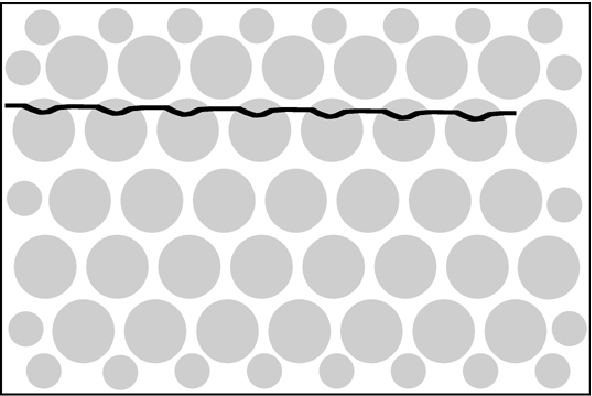
Figure 21:The PMTs (represented as circles) have a non-linear response as a function of position. As a result, the image of a straight radioactive line would be distorted as in this drawing.
In section Single crystal detector we have seen that the position of a scintillation in a large crystal is computed as the first moment in and directions (the “mass” center of the PMT response). This would be exact if the PMT response would vary linearly with position. In reality, the response is not perfectly linear, and as a result, the image is distorted. Figure 21 illustrates how the image of a straight radioactive wire can be deformed by this non-linear response. The response is systematic, so it can be measured, and the errors and can be stored as a function of and in a lookup table. Correction is then straightforward:
After correction, the image of a straight line will be a straight line.
For a system using multi-crystal detectors, the linearity correction must be applied within the modules, to make sure the correct individual detector is identified. Because we know exactly where each module and each detector is located, no further spatial corrections are required.
Because the system characteristics vary slowly in time, the linearity correction table needs to be measured every now and then. This is typically once a year or after a major intervention (e.g. after PMTs have been replaced).
To measure the linearity, we must make an image of a phantom, a well known object. One approach is to use a “dot-phantom”: the collimator is replaced with a lead sheet containing a matrix of small holes at regular positions. Then we put some activity in front of the sheet (e.g. we can use a point source at a large distance from the sheet), ensuring that all holes receive approximately the same amount of photons. With this set up, an image is acquired. Deviations between the image and the known dot pattern allow to compute and .
Energy correction
Recall that the energy of the detected photon was computed as the sum of all PMT responses (section Single crystal detector). Of course, the sum is dominated by the few PMTs close to the point of scintillation, the other PMT’s receive very few or even no scintillation photons. Because the PMT-characteristics show small individual differences, the computed energy is position dependent. This results in small shifts of the computed energy spectrum with position. The deviations are systematic (they vary only very slowly in time), so they can be measured and stored, so that a position dependent correction can be applied:
It is important that the energy window is nicely symmetrical around the photopeak, small shifts of the window result in significant changes in the number of accepted photons (Figure 22). Consequently, if no energy correction is applied, the sensitivity for acceptable photons would be position dependent.
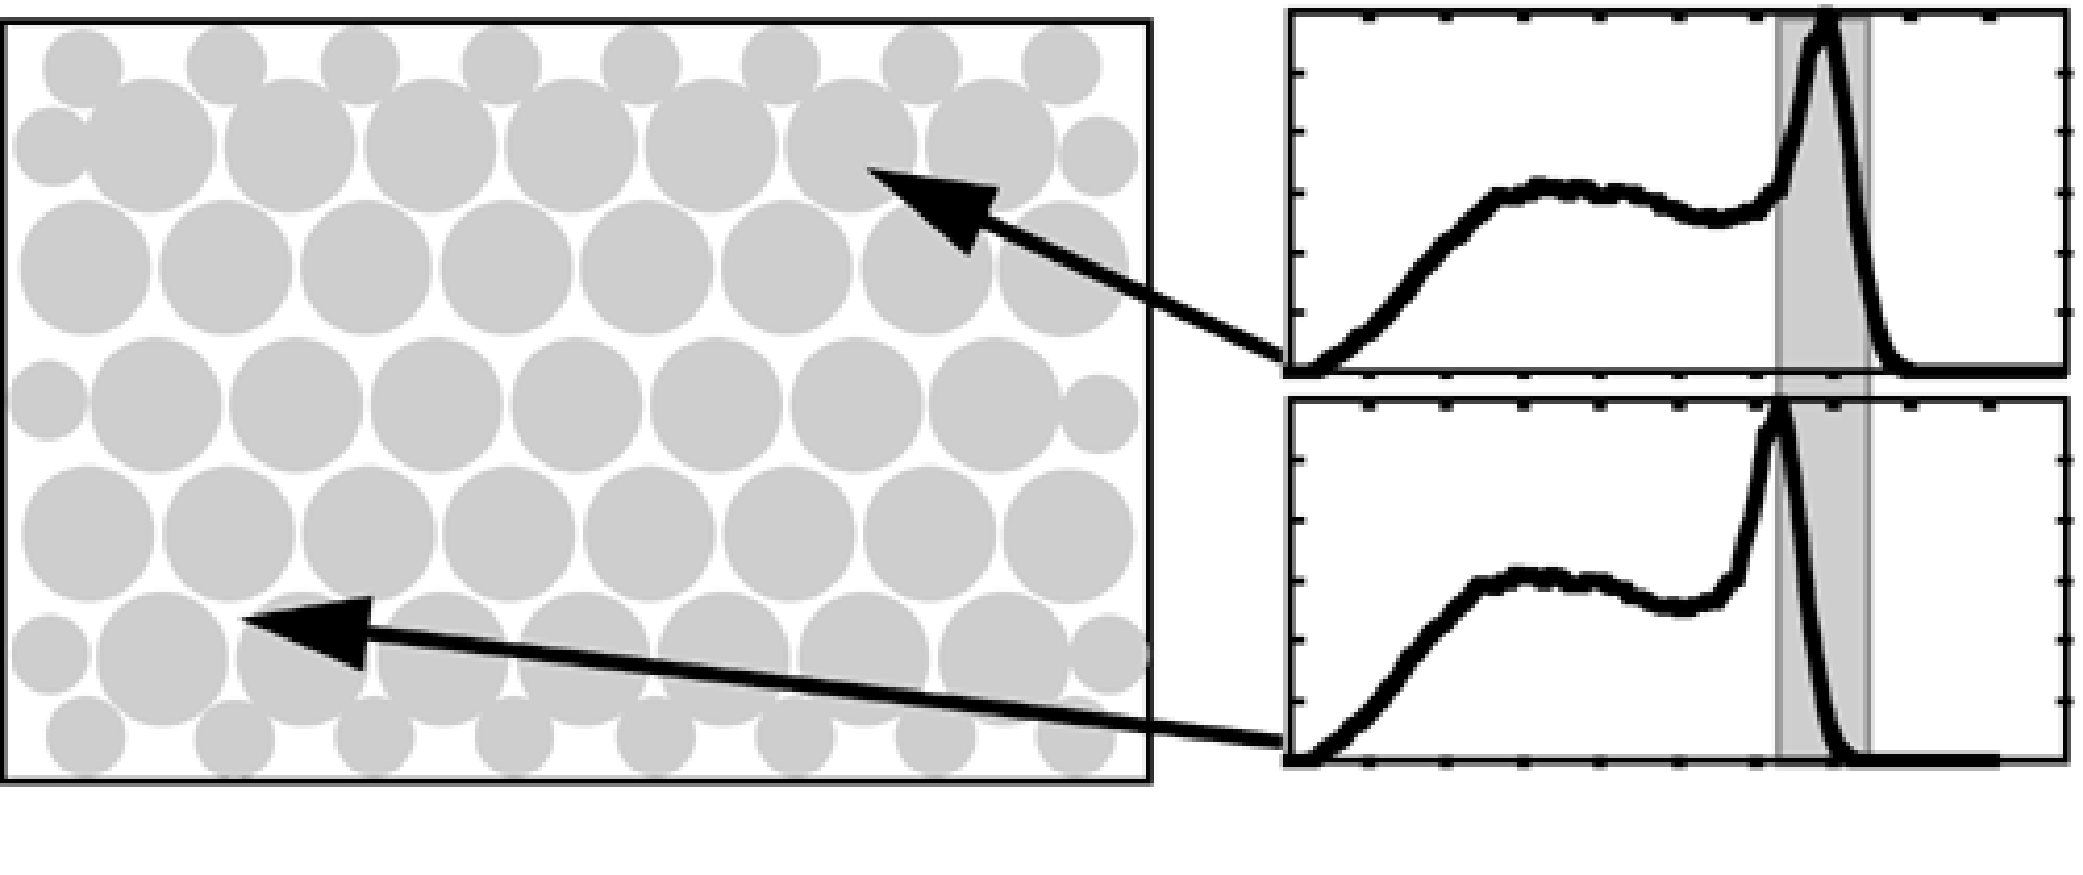
Figure 22:Because the characteristics of the photomultipliers are not identical, the conversion of energy to voltage (and therefore to a number in the computer) may be position dependent.
The energy correction table needs to be rebuilt about every six months or after a major intervention. The situation is similar for single crystal and multicrystal systems.
Uniformity correction
When linearity and energy correction have been applied, the image of a uniform activity distribution should be a uniform image. In practice, there may still be small differences, due to small variations of the characteristics with position (e.g. crystal transparency, optical coupling between crystal and PMT etc). Most likely, those are simply differences in sensitivity, so they do not produce deformation errors, only multiplicative errors. Again, these sensitivity changes can be measured and stored in order to correct them.
Gamma camera
To measure the uniformity of the detector, we acquire an image of a uniform activity. For the gamma camera, one approach is to put a large homogeneous activity in front of the collimator. Another possibility is to remove the collimator and put a point source at a large distance in front of the collimator. Let us assume that the point source is exactly in front of the center of the detector, at a distance from the crystal. The number of photons arriving in position per second and per solid angle is then
where is the strength of the source in Bq (Becquerel), and is the center of the crystal. However, we don’t need the number of photons per solid angle, but the number of photons per detector area. At position , the photons arrive at an angle . Thus, the solid angle occupied by a small square of detector equals . Because , we obtain for the number of photons detected in :
Thus, if we know the size of the detector and the uniformity error we will tolerate we can compute the required distance . You can verify that with , where is the length of the crystal diagonal, the maximum error equals about 1.5%.
The number of photons detected in every pixel is Poisson distributed. Recall from section Statistics that the standard deviation of a Poisson number is proportional to the square root of the expected value. So if we accept an error (a standard deviation) of 0.5%, we need to continue the measurement until we have about 40000 counts per pixel. Computation of the uniformity correction matrix is straightforward:
where is the acquired image.
Consequently, if a uniformity correction is applied to a planar image, one Poisson variable is divided by another one. The relative noise variance in the corrected image will be the sum of the relative noise variances on the two Poisson variables (see appendix Error propagation for estimating the error on a function of noisy variables).
PET camera
In PET-vocabulary, uniformity correction is often called detector normalization. The approach is similar as for the gamma camera, but it is more difficult to measure the relative sensitivity of each projection line than it is for a gamma camera. One approach is to slowly rotate a flat homogeneous phantom in the field of view, and only use measurements along projection lines (nearly) perpendicular to the phantom. It is time consuming, since most of the acquired data is ignored, but it provides a direct sensitivity measurement for all projection lines.
Alternatively, an indirect approach can be used. A sinogram is acquired for a large phantom in the center of the field of view. All individual detectors contribute to the measurement, and each detector is involved in multiple projection lines intersecting the phantom. However, many other detector pairs are not receiving photons at all. This measurement is sufficient to compute individual detector sensitivities. Sensitivity of a projection line can then be computed from the individual detector sensitivity and the known geometry. The result is a sinogram representing projection line sensitivities. This sinogram can be used to compute a correction for every sinogram pixel:
A typical sensitivity sinogram is shown in Figure 23. The sinogram is dominated by a regular pattern of zero sensitivity projection lines, which are due to small gaps between the detector blocks. In the projections one can see that there is a significant axial variation in the sensitivities. After normalization, the data from a uniform cylinder are indeed fairly uniform, except for these zero sensitivities. In iterative reconstruction, the data in these gaps are simply not used. For filtered backprojection, these data must first be filled with some interpolation algorithm.
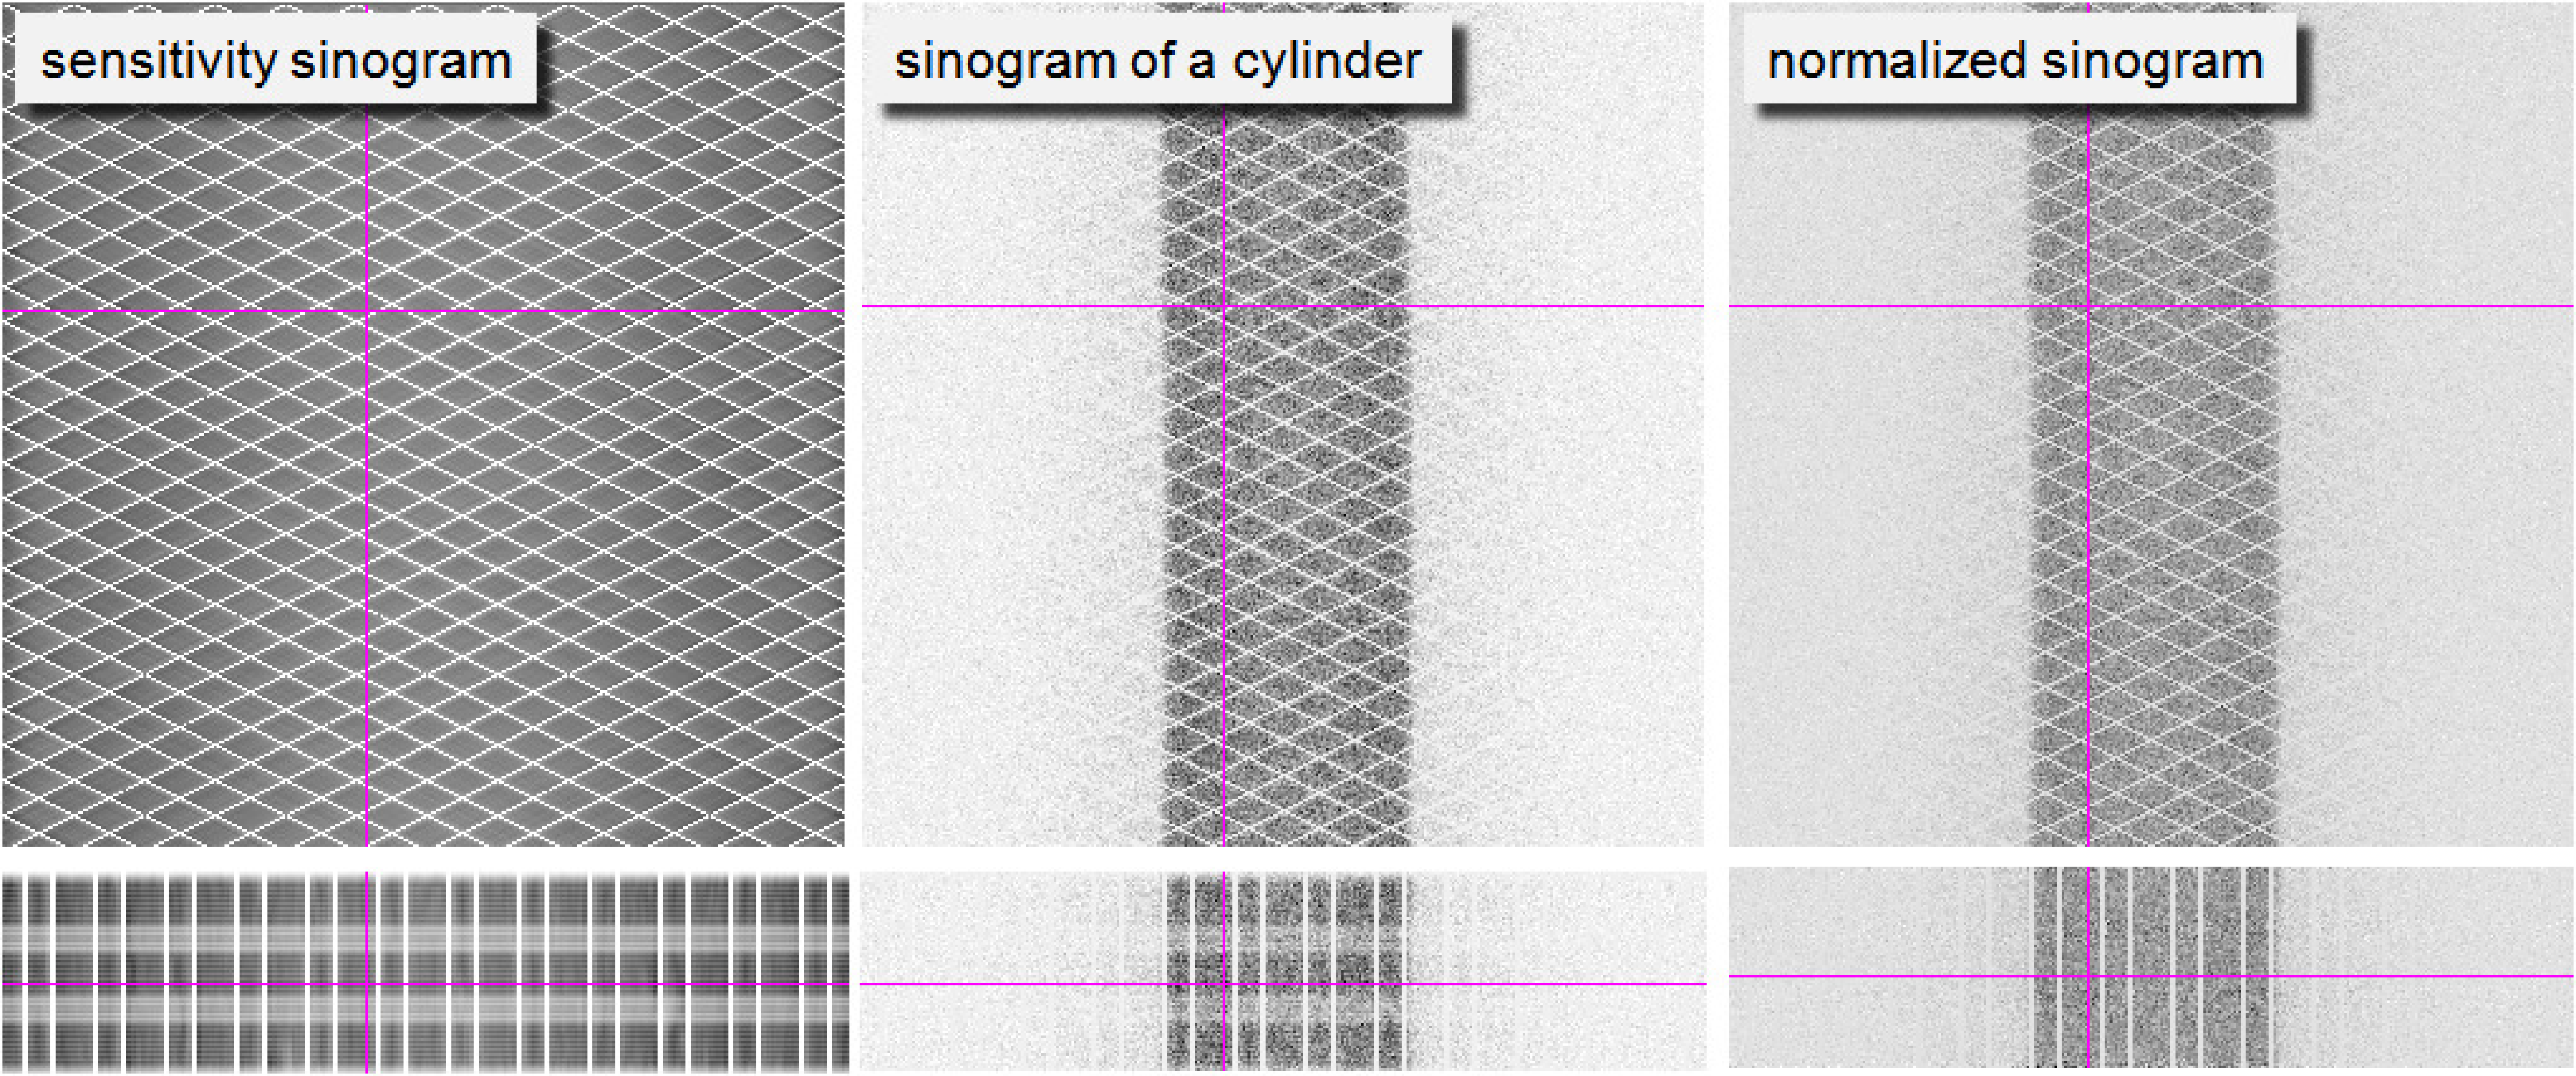
Figure 23:Left: PET sensitivity sinogram. Center: the sinogram of a cylinder filled with a uniform activity. Right: the same sinogram after normalization. The first row are sinograms, the second row projections, the cross-hairs indicate the relative position of both. Because there are small gaps between detector blocks, there is a regular pattern of zero sensitivity projection lines, which are of course not corrected by the normalization.
Dead time correction
“Dead time” means that the system has a limited data processing capacity. If the data input is too high, a fraction of the data will be ignored because of lack of time. As a result, the measured count rate is lower than the true count rate, and the error increases with increasing true count rate. Figure 24 shows the measured count rate as a function of the true count rate for a dead time of 700 ns. The gamma camera and the PET camera both have a finite dead time, consisting of several components. To describe the dead time, we will assume that all contributions can be grouped in two components, a front-end component and a data-processing component.
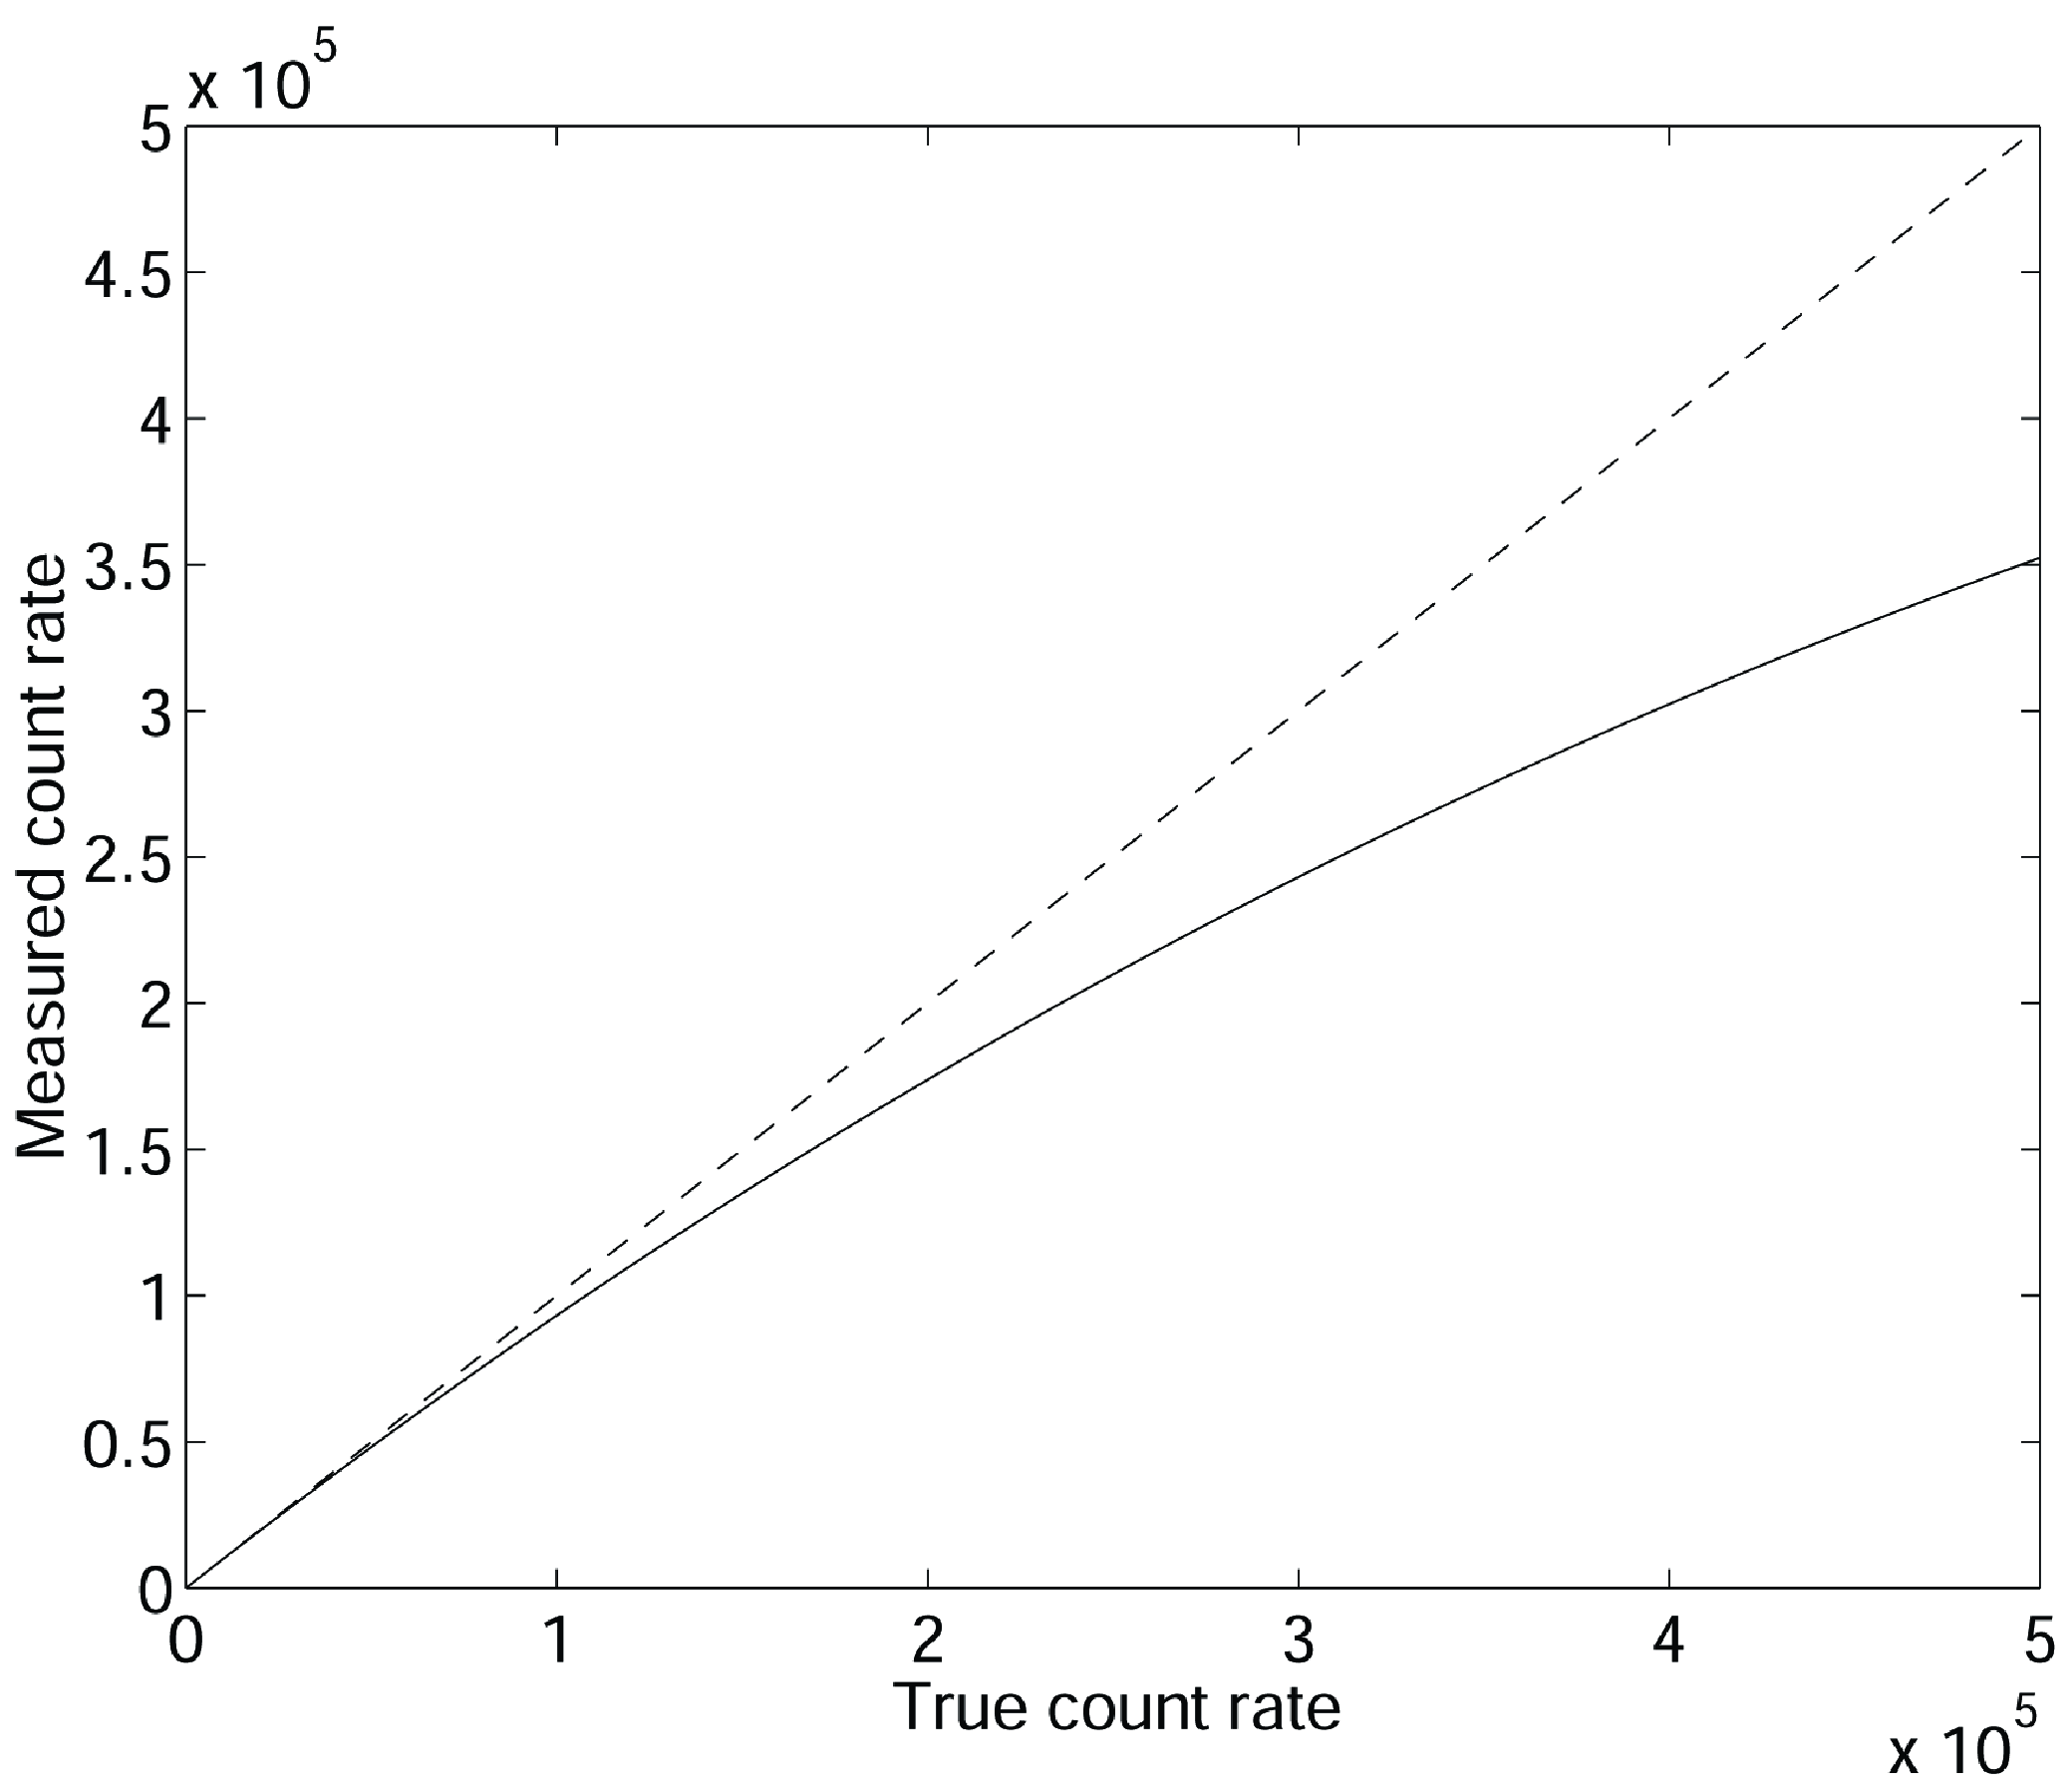
Figure 24:Due to dead time, the measured count rate is lower than the true count rate for high count rates. The figure is for a dead time of 700 ns, the axes are in counts per second. Measured count rate is 20% low near 300000 counts per second.
Front-end dead time
Recall (section Single crystal detector) that the scintillation has a finite duration. E.g., the decay time of NaI(Tl) is 230 ns. The PMT response time adds a few ns. To have an accurate estimate of the energy, we need to integrate over a sufficient fraction of the PMT-outputs, such that most of the scintillation photons get the chance to contribute. Let us assume that the effective scintillation time is , and that we integrate over that time to compute position and energy. Then the result is only correct if no new scintillation starts during that period, and no old one is ending during that period (so the previous scintillation must be older than ). Otherwise, part of this other scintillation will contribute as well, the energy will be overestimated and the photon is rejected. Consequently, a photon is only detected if in a time exactly one photon arrives. If we have a true count rate of , then we expect photons in the interval . Recall that the number of photons is Poisson distributed, so the probability of having 1 photon when are expected is . This is the count per time , so the count rate of accepted events will be
Notice that if is extremely large, goes to zero: the system is said to be paralyzable. Indeed, if the count rate is extremely high, every scintillation will be disturbed by the next one, and the camera will accept no events at all.
Data-processing dead time
When the event is accepted, the linearity correction must be applied and it must be stored somehow: the electronics either stores it in a list, and increments the pointer to the next available address, or it increments the appropriate location in the image. This takes time, let us say . If during that time another event occurs, it is simply ignored. Consequently, a fraction of the incoming events will be missed, because the electronics is not permanently available.
Assume that the electronics needs to store data at a rate of (unit ). Each of these requires s, so in every second, are already occupied for processing data. The efficiency of the system is therefore , which gives us the relation between incoming count rate and processed count rate :
Rearranging this to obtain as a function of results in
This function is monotonically increasing with upper limit (as you would expect: this is the number of intervals of length in one second). Consequently, the electronics is non-paralyzable. You cannot paralyze it, but you can saturate it: if you put in too much data, it simply performs at maximum speed ignoring all the rest.
Effective dead time
Combining (31) and (33) tells us the acceptance rate for an incident photon rate of :
If the count rates are small compared to the dead times (such that is small), we can introduce an approximation to make the expression simpler. The approximation is based on the following relations, which are acceptable if is small:
Applying this to (31) and (33) yields:
Combining both equation and deleting higher order terms results in
So if the count rate is relatively low, there is little difference between paralyzable and non-paralyzable dead time, and we can obtain a global dead time for the whole machine by simply adding the contributing dead times. Most clinical gamma cameras and all PET systems provide dead time correction based on some dead time model. However, for very high count rates the models are no longer valid and the correction will not be accurate.
Random coincidence correction
The random coincidence was defined in section Electronic and mechanical collimation in the PET camera: two non-related events may be detected simultaneously and be interpreted as a coincidence. There is no way to discriminate between true and random coincidences. However, there is a “simple” way to measure a reliable estimate of the number of randoms along every projection line. This is done via the delayed window technique.
The number of randoms (equation (23)) was obtained by squaring the probability to measure a single event during a time window τ. In the delayed window technique, an additional time window is used, which is identical in length to the normal one but delayed over a short time interval. The data for the second window are monitored with the same coincidence electronics and algorithms as used for the regular coincidence detection, ignoring the delay between the windows. If a coincidence is obtained between an event in the normal and an event in the delayed window, then we know it has to be a random coincidence: because of the delay the events cannot be due to the same annihilation. Consequently, with regular windowing we obtain trues + randoms1, and with the delayed method we obtain a value randoms2. The values randoms1 and randoms2 are not identical because of Poisson noise, but at least their expectations are identical. Subtraction will eliminate the bias, but will increase the variance on the estimated number of trues. See appendix Error propagation for some comments on error propagation.